What is defect density?
Defect density is a metric in software quality assurance that measures the number of defects relative to the size of a software module or system providing insight into quality and reliability. This guide will cover how to effectively monitor, analyze, and report defect density using advanced analytics techniques.
Understanding defect density
Defect density is calculated by dividing the number of discovered defects by the size (typically measured in lines of code or function points) of the software system being examined. This metric helps identify areas of the codebase that may require more focused testing or other improvements. High defect density may also indicate overly complex or poorly designed modules.
Implementing defect density monitoring
To set up effective defect density monitoring:
- Implement tracking systems: Use issue tracking and project management tools like Linear and Jira to log and categorize defects.
- Define scope: Specify the modules or features to track along with the time period for analysis.
- Standardize defect classification: Ensure consistency in how defects are categorized and severity is assigned.
Creating defect density reports
Creating a comprehensive defect density report involves several steps:
- Data collection: Gather data on defects, including type, severity, and when they were discovered.
- Calculation: Calculate the defect density by dividing the total number of defects by the size of each component.
- Visualization: Use charts and graphs to represent the data visually. A defect density chart typically plots the number of defects present in the codebase over time.
Defect density report outline
A typical defect density report usually includes:
- An overview section: Summary of total defects and overall defect density.
- Detailed analysis: Breakdown by module, showing each module's defect count and density.
- Trends over time: How defect density has changed over time, indicating the effectiveness of quality initiatives.
Using defect density dashboards
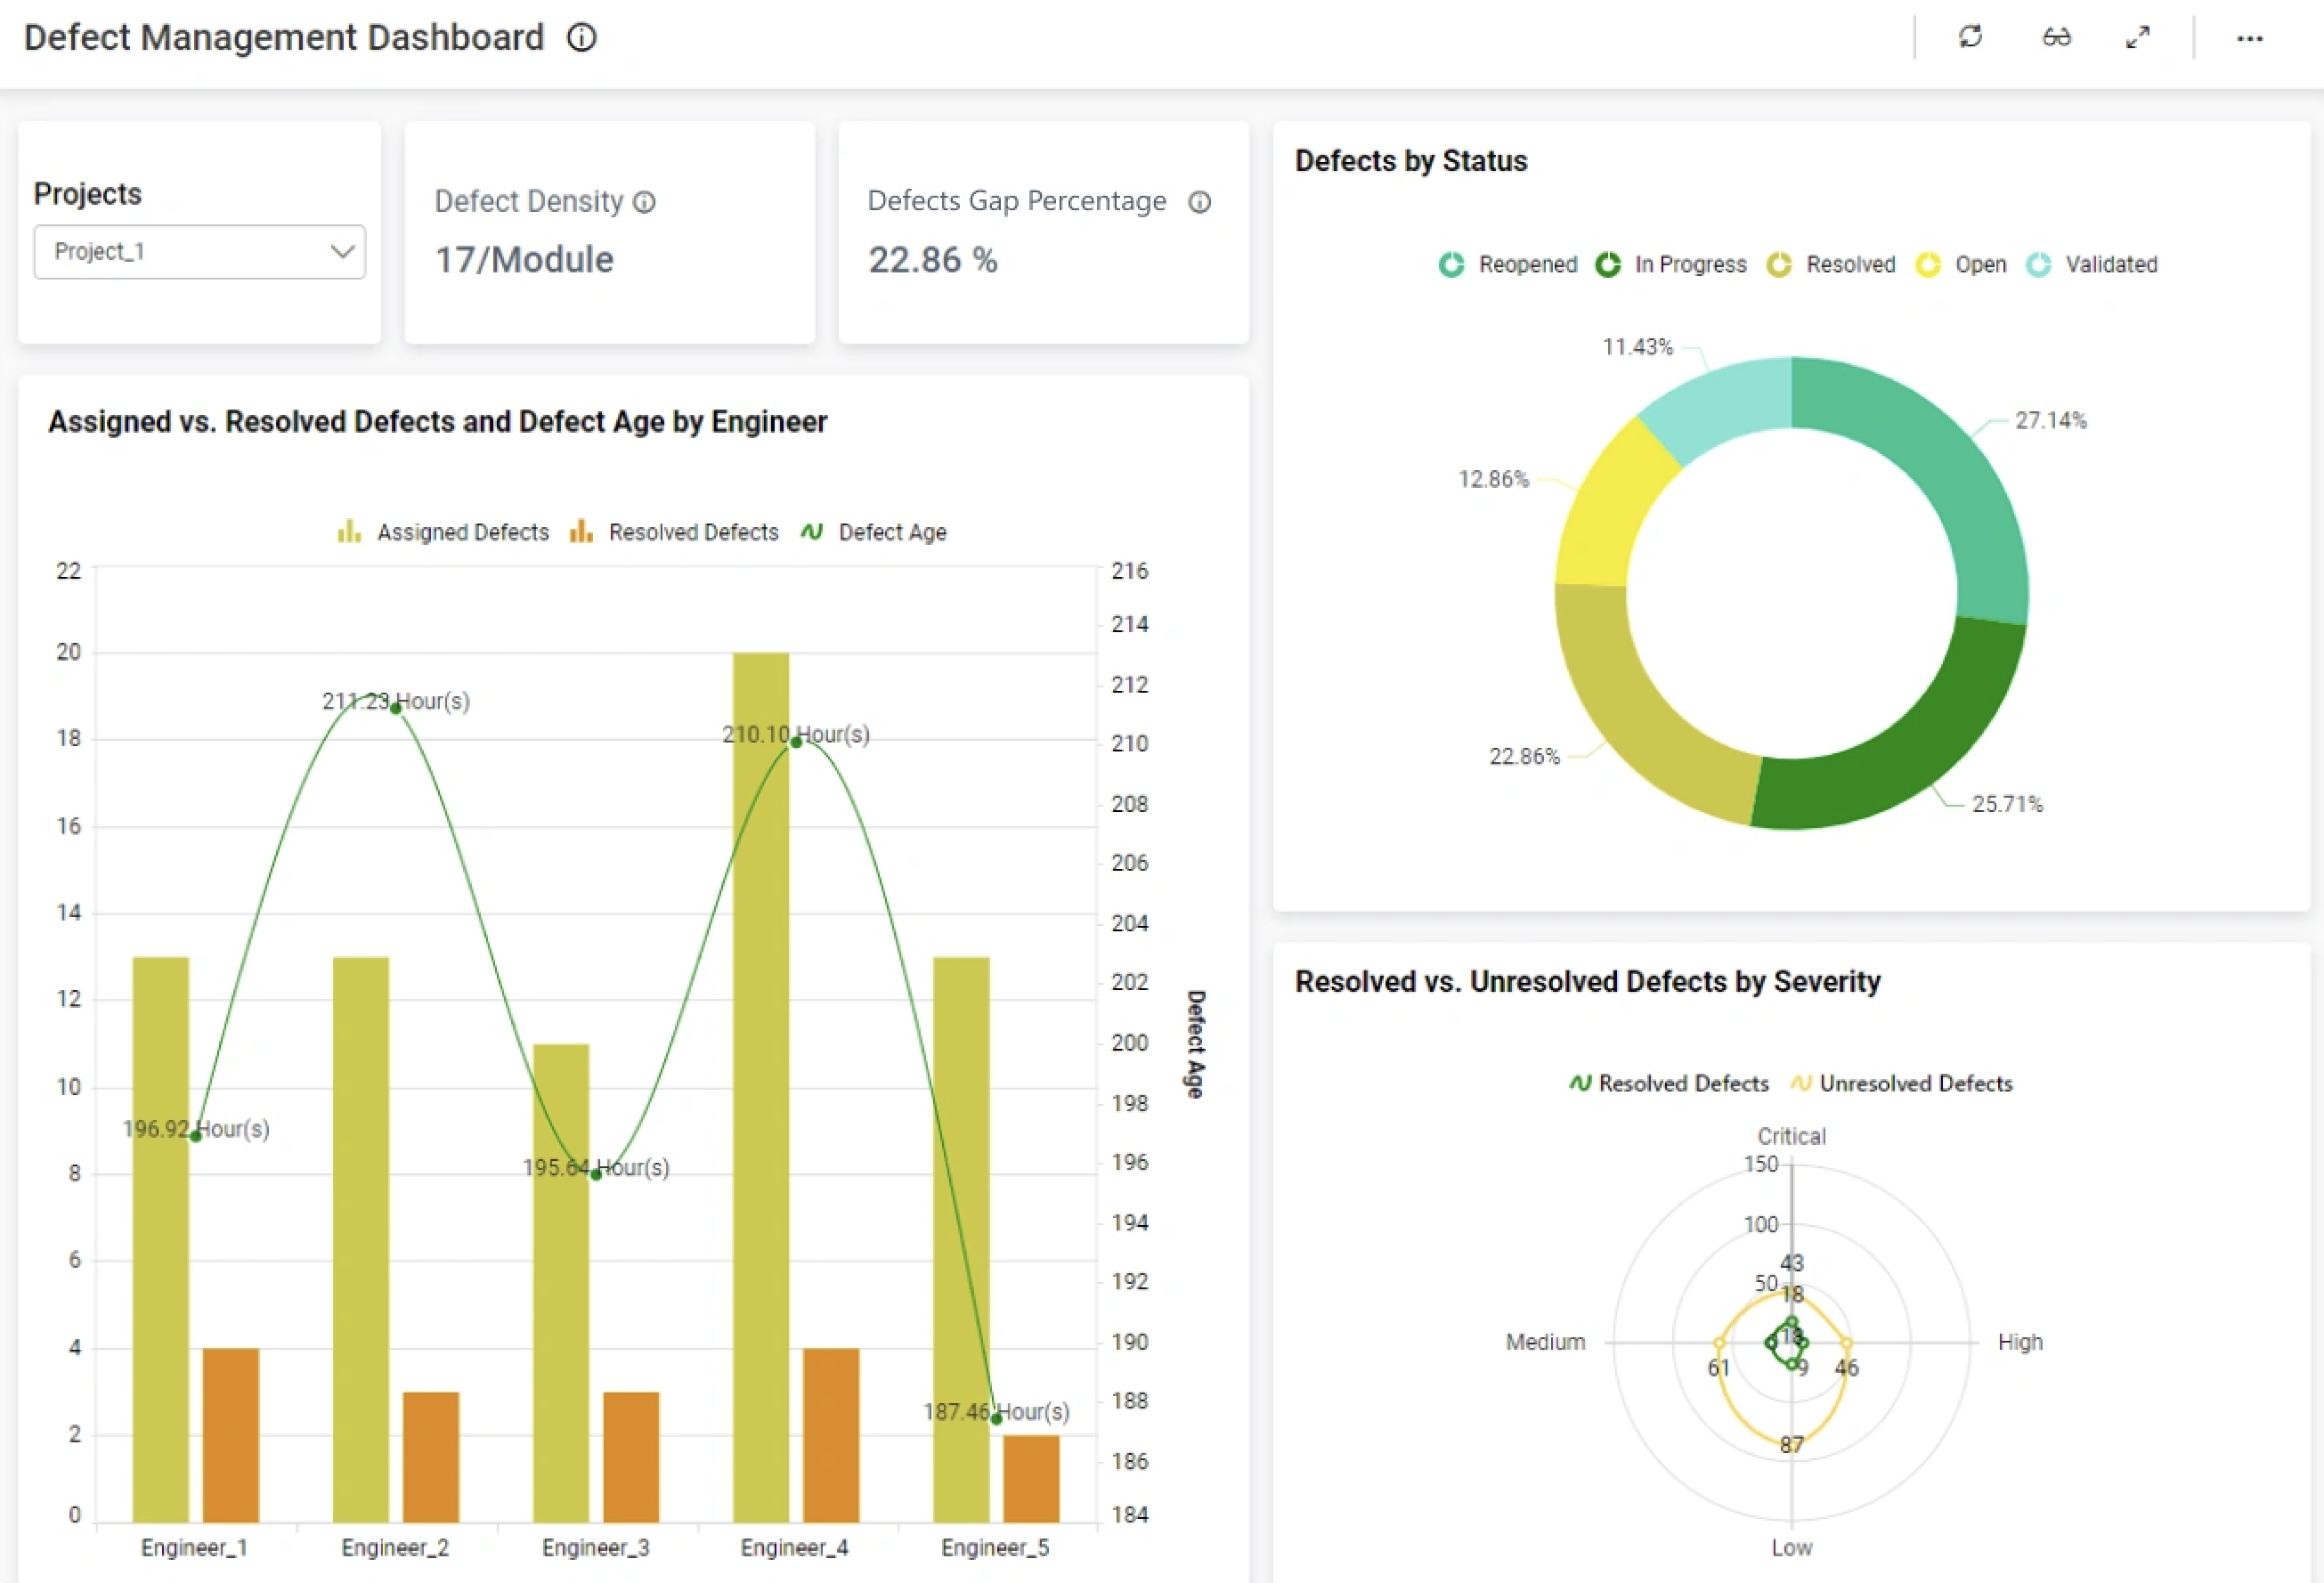
Dashboards provide a real-time view of defect metrics and are essential for ongoing monitoring. A defect density dashboard might feature:
- Defect severity: Reflecting how impactful defects are to end users.
- Defect status: Providing an overview of which defects still need attention.
- Alerting: Notifications for when defect density exceeds a predefined threshold.
Analyzing defect density
Deep analysis of defect density can uncover underlying issues in the development process. Types of defect density analysis include:
- Correlation: Examining relationships between defect density and other factors like module complexity or team velocity.
- Regression: Identifying trends and predicting future defect occurrences.
How defect density metrics can be improved
Improving defect density metrics involves:
- Enhancing testing strategies: More thorough testing can reduce the number of defects.
- Refactoring code: Simplifying complex modules may decrease defect density and increase maintainability.
- Improving documentation and training: Ensuring everyone understands the codebase and is aligned on development standards.
Advanced analytics and reporting for defect density can be very important in managing software quality, especially at scale. By regularly monitoring, analyzing, and reporting on defect density, teams can proactively manage software quality, leading to more reliable and maintainable products.
Using Graphite Insights to enhance code review cycles
Graphite Insights empowers development teams by providing detailed analytics on pull requests (PRs) and code review performance. While it doesn’t directly measure defect density, it offers tools to improve processes that indirectly contribute to better quality control. Here's how:
Tracking pull request metrics
Graphite Insights provides a range of metrics to help teams understand how PRs flow through the review and merge process. Key data points include:
- Total PRs merged: Helps track productivity and the pace at which changes are integrated into the main branch.
- Average review cycles: Highlights how many rounds of feedback a PR goes through before it is approved, shedding light on code review efficiency.
- Median publish-to-merge time: Offers insights into how quickly PRs move through the pipeline, indicating bottlenecks in the review process.
Analyzing review responsiveness
Graphite Insights surfaces metrics such as:
- Median review response time: Measures how quickly reviewers respond to assigned PRs, ensuring timely feedback.
- Wait time to first review: Tracks delays between PR creation and the first review, helping teams address slowdowns.
These insights allow teams to identify areas for process improvements, such as balancing workloads among reviewers or refining team practices to reduce delays.
Monitoring trends and team performance
By visualizing trends over time, Graphite Insights helps teams understand the impact of changes in their workflows. Examples include:
- Identifying if smaller PRs lead to faster review times.
- Comparing review metrics for different team members to identify mentorship opportunities or areas requiring additional support.
- Monitoring the ratio of reviewed PRs to merged PRs to ensure high-quality standards are maintained.
Custom views and collaboration
Graphite Insights supports customizable dashboards and the ability to save and share views with teammates. This promotes transparency and collaboration across the team by aligning everyone on critical metrics. For instance, teams can use shared dashboards to discuss trends in review times during retrospectives and set actionable goals for improvement.
By offering actionable insights into the PR and code review process, Graphite Insights equips developers with the tools they need to streamline reviews, optimize workflows, and maintain a high standard of code quality.