Table of contents
- Why does a GitHub PR dashboard matter?
- Why not use the default GitHub data for visibility?
- What PR metrics to consider for your GitHub PR dashboard
- How Graphite helps create GitHub PR dashboards
- Getting started with Graphite Insights: KPIs for your GitHub PR dashboards
- Putting insights into action with Graphite for GitHub PR dashboards
- FAQ
As an engineering leader, you know that having visibility into your team's code review performance is critical. Without it, it's virtually impossible to identify bottlenecks, test changes, and optimize workflows.
That's why modern developer workflow tools have become so invaluable. They promise robust GitHub integrations and PR dashboards that give engineering managers a complete view of team output.
In this post, we'll explore how you can use one such powerful tool, Graphite, and its Insights feature to build a best-in-class GitHub PR dashboard for your team.
Why does a GitHub PR dashboard matter?
A GitHub pull request dashboard gives you an objective way to measure how you achieve your goals over time. This overview allows you to implement an operations rhythm of continuous improvement around shipping code quickly and efficiently.
With a dashboard, you gain insights into questions like:
How long do PRs take from the first commit to merge?
How much time do developers spend waiting on code reviews?
How many PRs do developers open per day/week/month?
Are there any outliers in the code review process?
Are pull request best practices being followed?
Armed with this data, you can then take steps to:
Identify bottlenecks and implement learning programs.
Understand overall team throughput.
Test changes like shortened code review SLAs and measure impact.
Spot overburdened developers and redistribute work.
Why not use the default GitHub data for visibility?
Out of the box, GitHub offers very basic PR tracking functionality. Even though GitHub provides the underlying infrastructure, it lacks visibility into team execution, such as:
How fast are developers able to move ideas to production?
Where are bottlenecks occurring in the code review process?
Is the team keeping up with incoming demand?
These questions are left unanswered since GitHub doesn't provide any visibility.
Team managers need more detailed analytics to inform their decisions, and developers need better visibility to coordinate around blockers.
GitHub doesn’t provide the depth of data required to optimize a modern, fast-paced engineering workflow.
At least not alone. This is where developer workflow tools like Graphite come in. Purpose-built for GitHub users, Graphite captures a wealth of signals to help developers work smarter and companies ship better products faster.
What PR metrics to consider for your GitHub PR dashboard
Pull request volume: The number of pull requests opened over time. You can break this down by PRs per day, per developer, and per month.
Time-to-merge: The elapsed time from opening a PR to merging it. Capture the average time per PR and average time per developer to get a better perspective.
Wait times: The time developers spend waiting on code reviews or QA.
Reviewer bandwidth: For each reviewer, capture the number of PRs reviewed monthly, average PR turnaround time, and distribution of turnaround times.
PR size: The number of files, additions, and deletions per PR.
PR throughput: Number of PRs merged per sprint or release.
Defect escape rate: Percentage of PRs that introduced bugs caught in production.
Those are a few examples of metrics you can begin with. However, as the team matures, you want a dashboard that you can easily customize to fit the new needs.
How Graphite helps create GitHub PR dashboards
Graphite is a developer workflow tool that integrates directly with GitHub to pull comprehensive PR data into a dedicated portal. Beyond basic metadata, Graphite gives managers total visibility into:
PR workflow bottlenecks.
The volume of PRs, number of lines changed, and number of reviews.
Reviewer workloads, broken down individually.
Cycle times by team, organization, and project area.
Graphite then translates this data into actionable insights via its PR inbox and Insights analytics dashboards.
Developers also benefit from features like stacking pull requests and bulk merge workflows. Once you integrate Graphite, it automatically does the tracking for you. You can then change and move around sections of the Graphite Insights dashboard to show the data you want to see.
Two-way GitHub sync for direct access to PR data
Graphite connects directly to GitHub using secure OAuth authentication. From there, it maintains a real-time two-way synchronization of all pull request data. Whenever developers create, comment on, or merge PRs on GitHub, Graphite instantaneously reflects these changes.
This synchronization powers Graphite’s downstream analytics while still ensuring engineers can use their existing GitHub workflows. There's no disruption to developers' preferred tools.
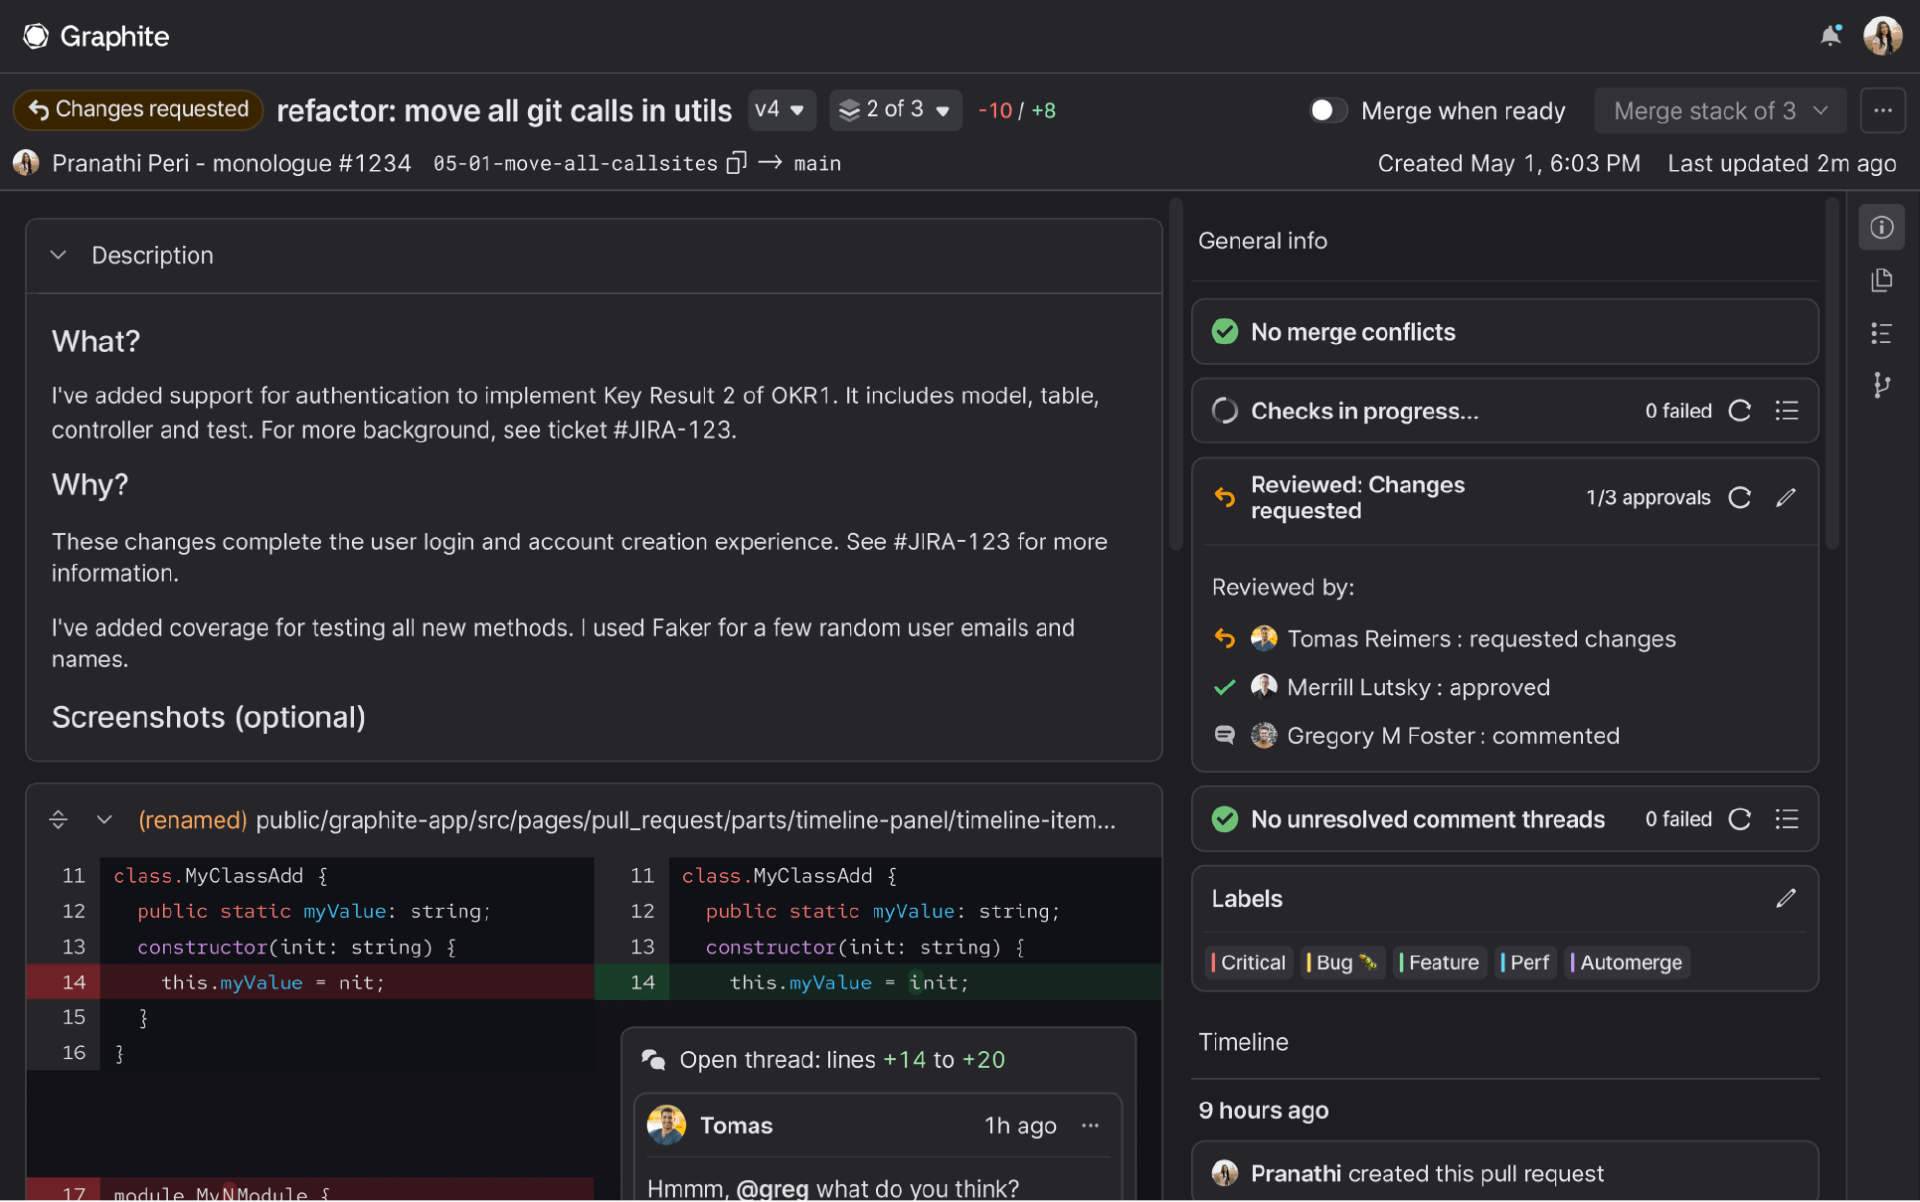
Customizable PR inbox to see what needs attention
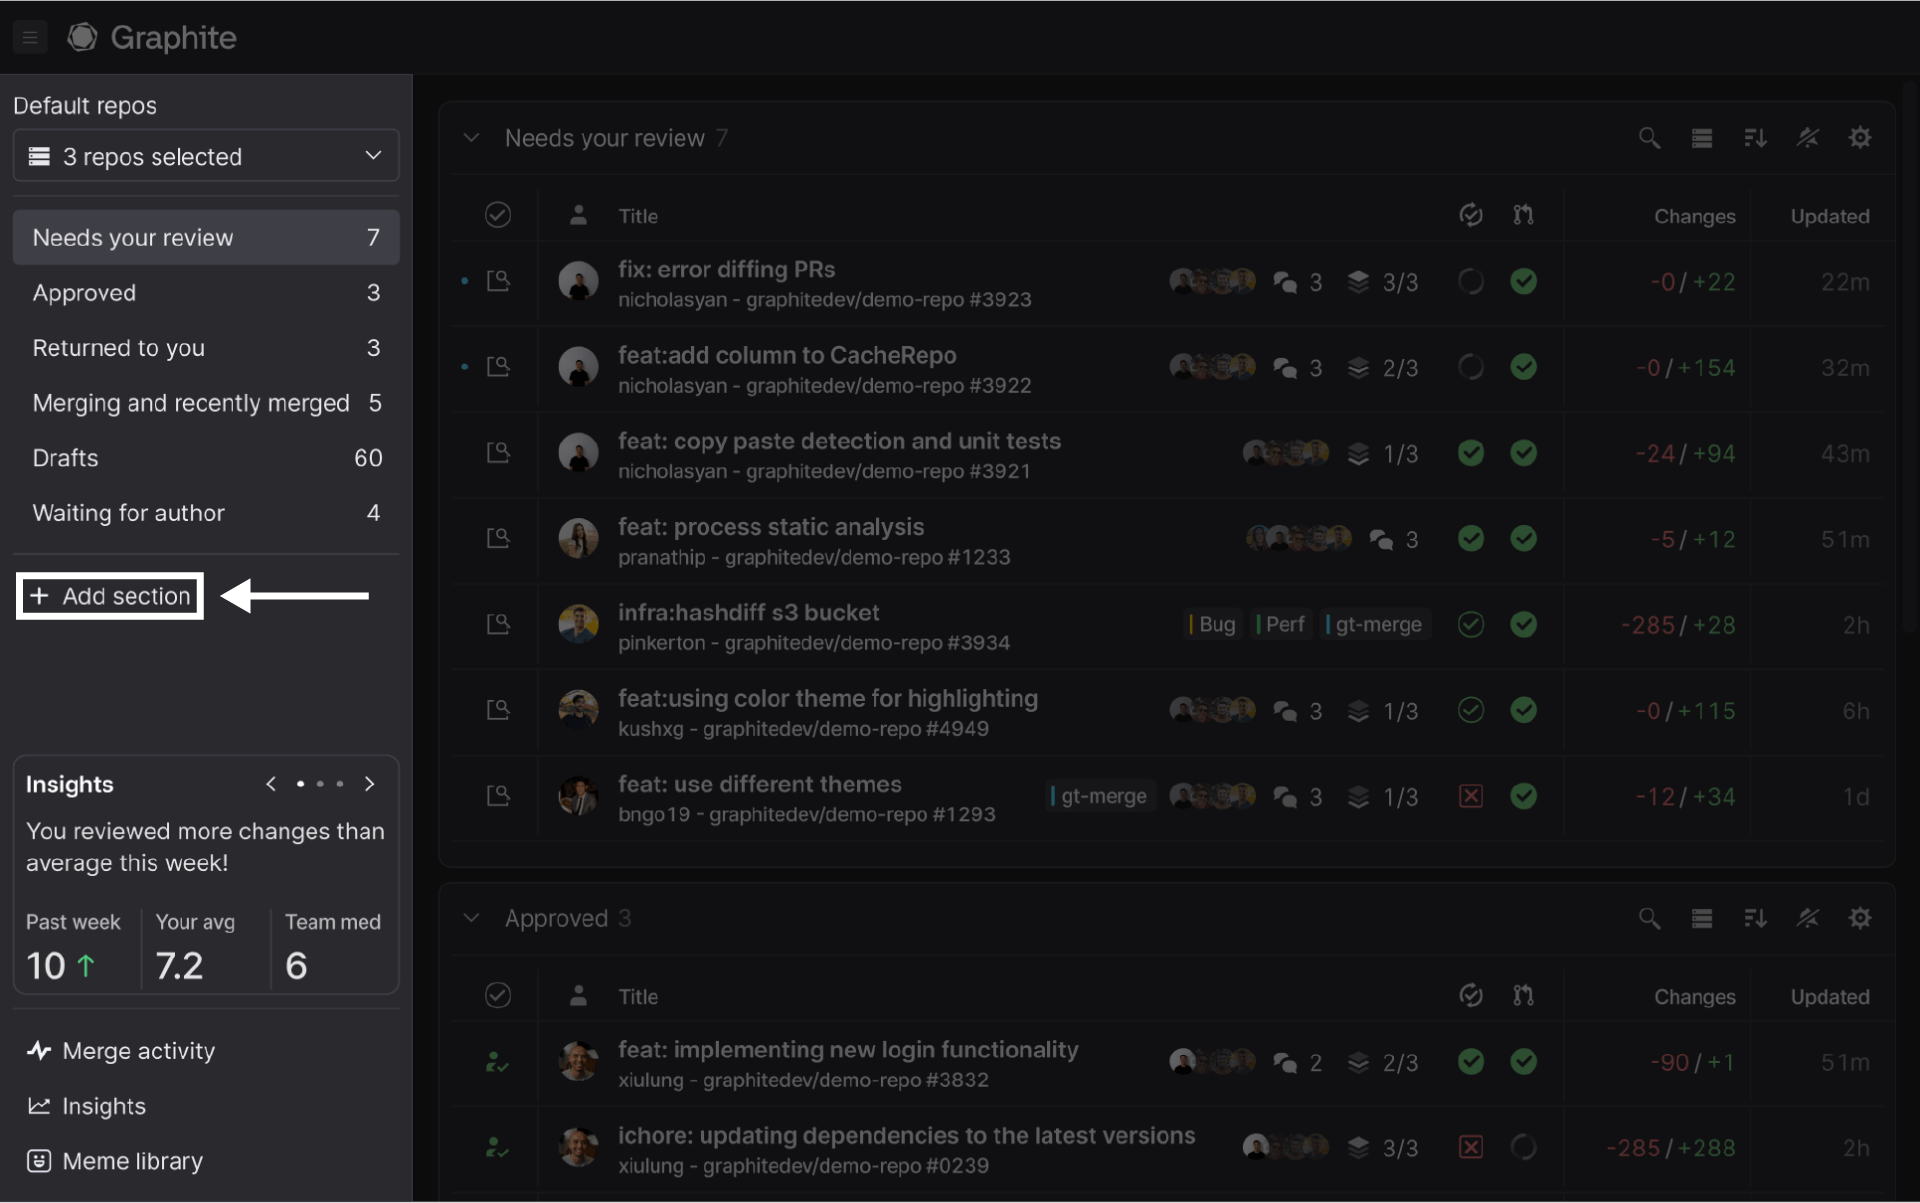
Graphite aggregates every open pull request across all connected repositories into one universal inbox. Developers can see assigned reviews and track PRs that require their attention from an organization-wide perspective.
Managers, on the other hand, gain a centralized hub to monitor PR distribution across teams. This eliminates redundant notifications from disparate GitHub repos, enabling smarter review assignments.
Visual pull request stacks to avoid dependency mess
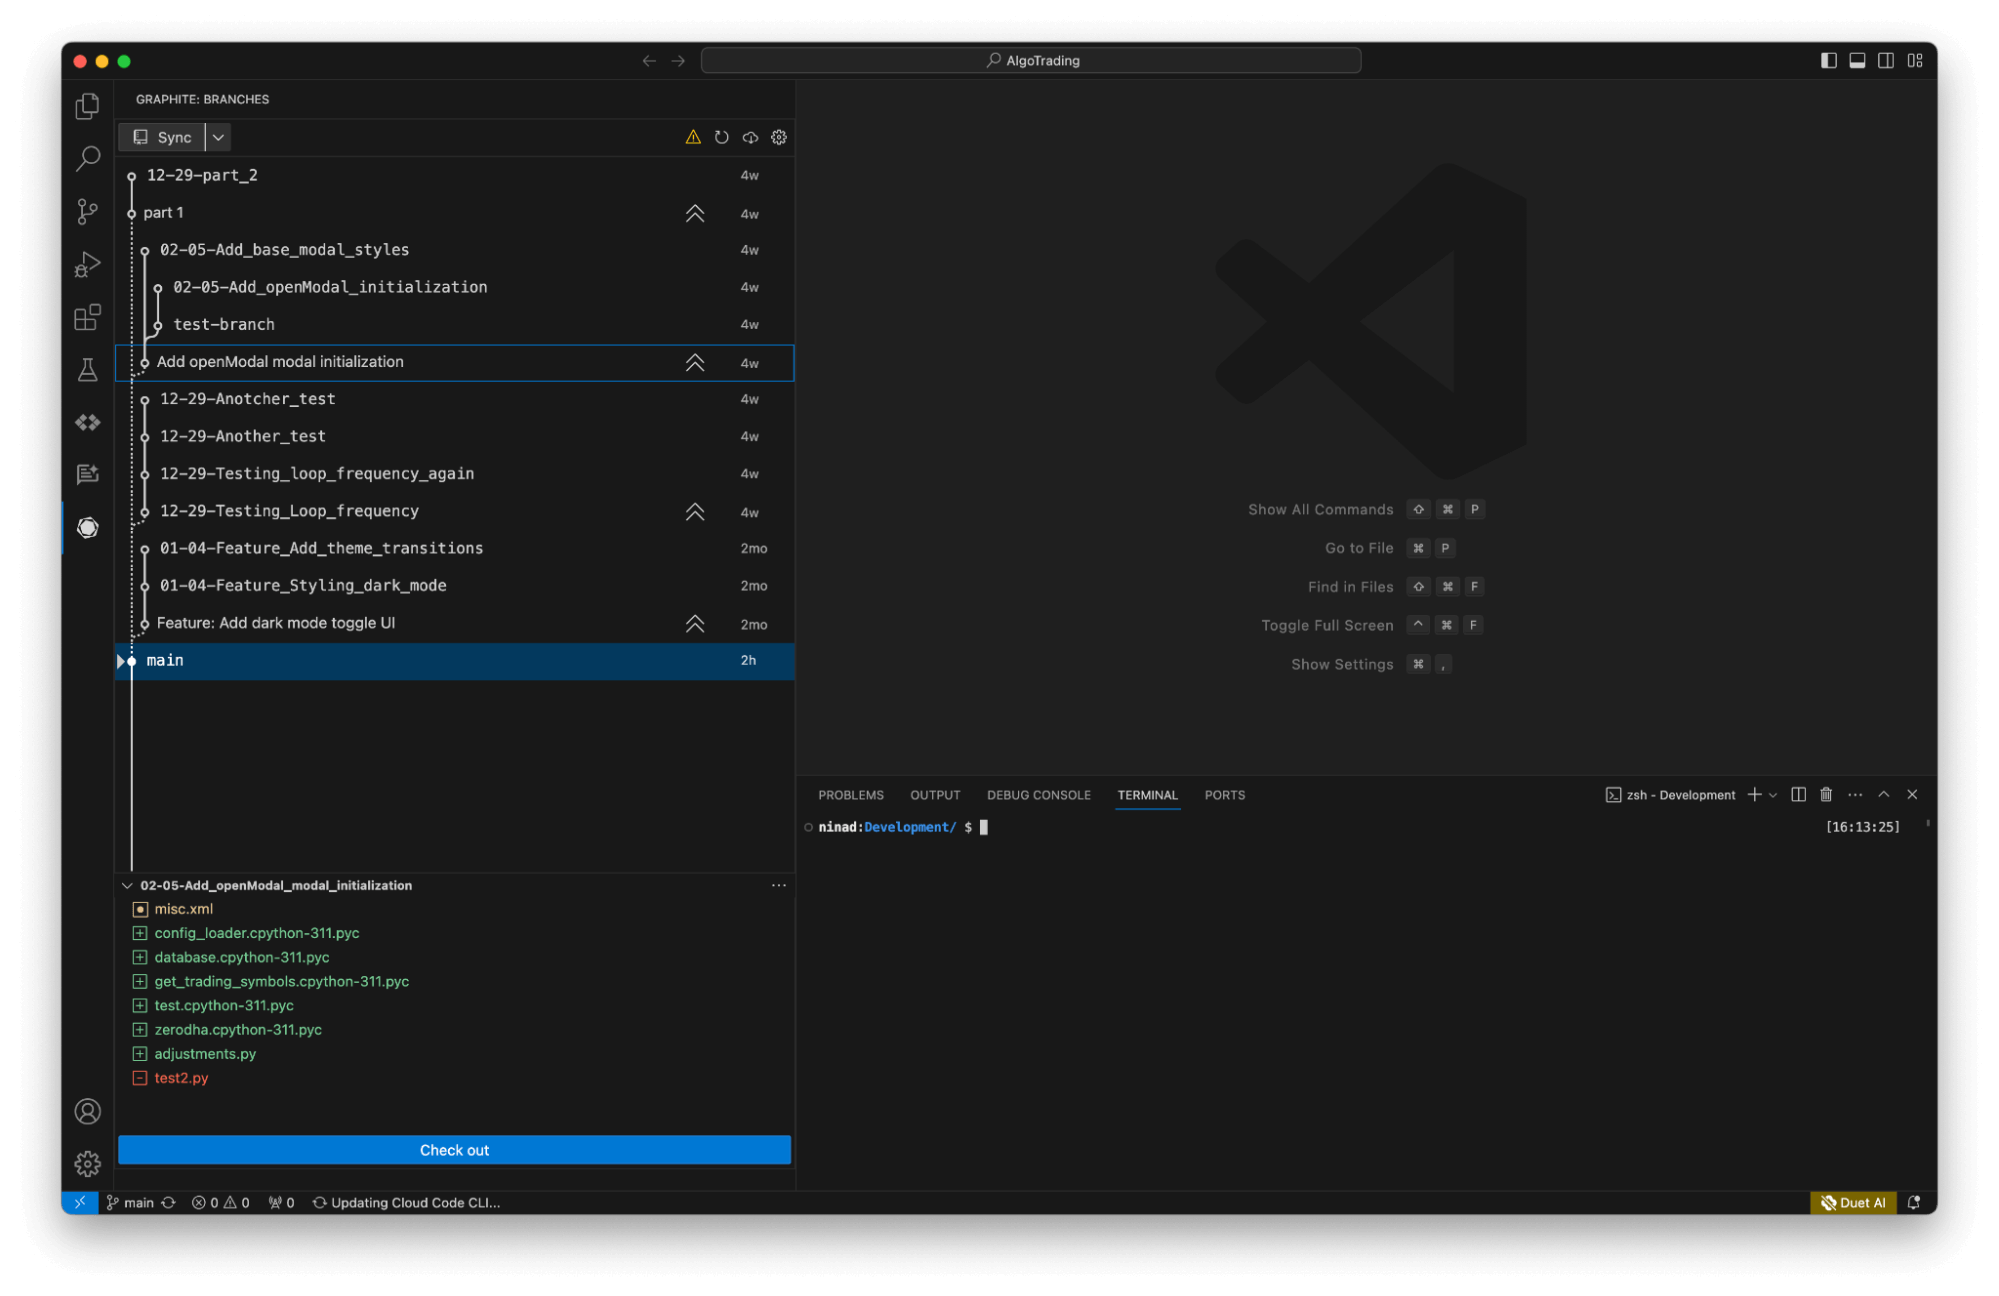
Graphite also facilitates a pull request stacking workflow through its CLI integration and VS Code extension. Stacking lets developers chain pull requests on top of one another to enable continuous, unblocked reviews.
The key idea behind stacked pull requests is that each pull request incrementally builds on the last. Take, for example, adding a checkout flow to an ecommerce site.
This would involve:
PR 1: Adds checkout button to the shopping cart page.
PR 2: Uses the checkout button code to build out the billing/payment form then.
PR 3: Takes the form submission logic to integrate with a payment processor.
PR 4: Finalizes order creation using the payment details.
Notice how each PR takes what the previous one did, and expands on it:
**PR 2 **directly branches off the code from PR 1, instead of main.
PR 3 builds right on top of PR 2's form handling.
PR 4 finishes off order creation beginning from PR 3.
So, changes stack in a way that each PR extends capability incrementally. This building block approach allows continuous integration of chunks of code and devs can continue working without being blocked.
Graphite also auto-rebases stacks before merging to eliminate cascading merge conflicts. This optimized process saves engineers tremendous hassle compared to managing stacks across bare GitHub projects.
Stack merging
Tied to PR stacking, Graphite also offers stack merge capabilities that are unavailable on GitHub. This feature lets engineers select multiple stacked PRs and merge them in proper order.
Stack merging helps eliminate headaches from managing separate PRs related to each other. When these stacks are merged after approvals, you can reduce the merge conflicts that may otherwise arise when manually handling dependent PRs.
Insights analytics
Graphite has a powerful analytics dashboard called Insights. Insights translates the raw GitHub data into interactive graphs and detailed tables covering every PR workflow KPI.
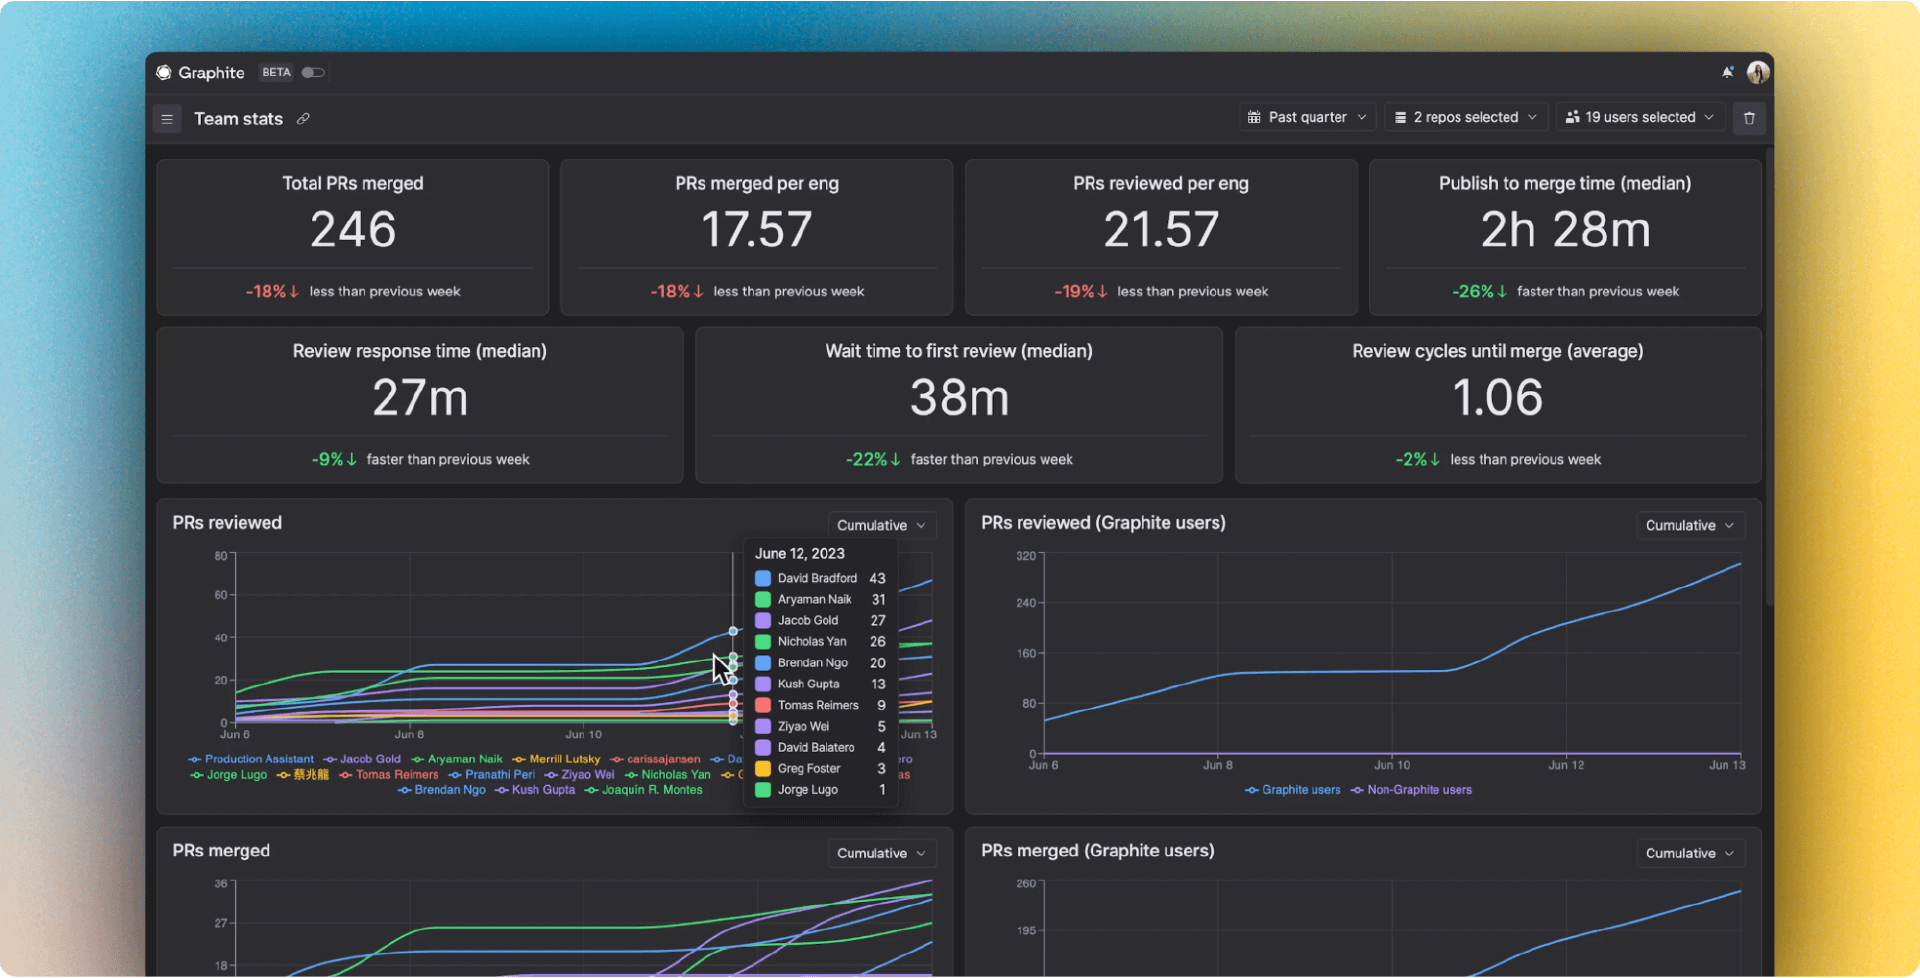
Managers gain unprecedented visibility into development velocity, review workload distribution, PR cycle times, and more. The dashboards update continually via GitHub sync, presenting a real-time view of engineering productivity.
Getting started with Graphite Insights: KPIs for your GitHub PR dashboards
Now that we've covered Graphite's core capabilities, let's see them in action for creating a best-in-class PR dashboard.
Specifically, we'll highlight key pull request KPIs displayed within Graphite's Insights analytics. We’ll explain each metric’s importance and how engineering leaders can leverage the insights to optimize productivity.
Tracking team throughput
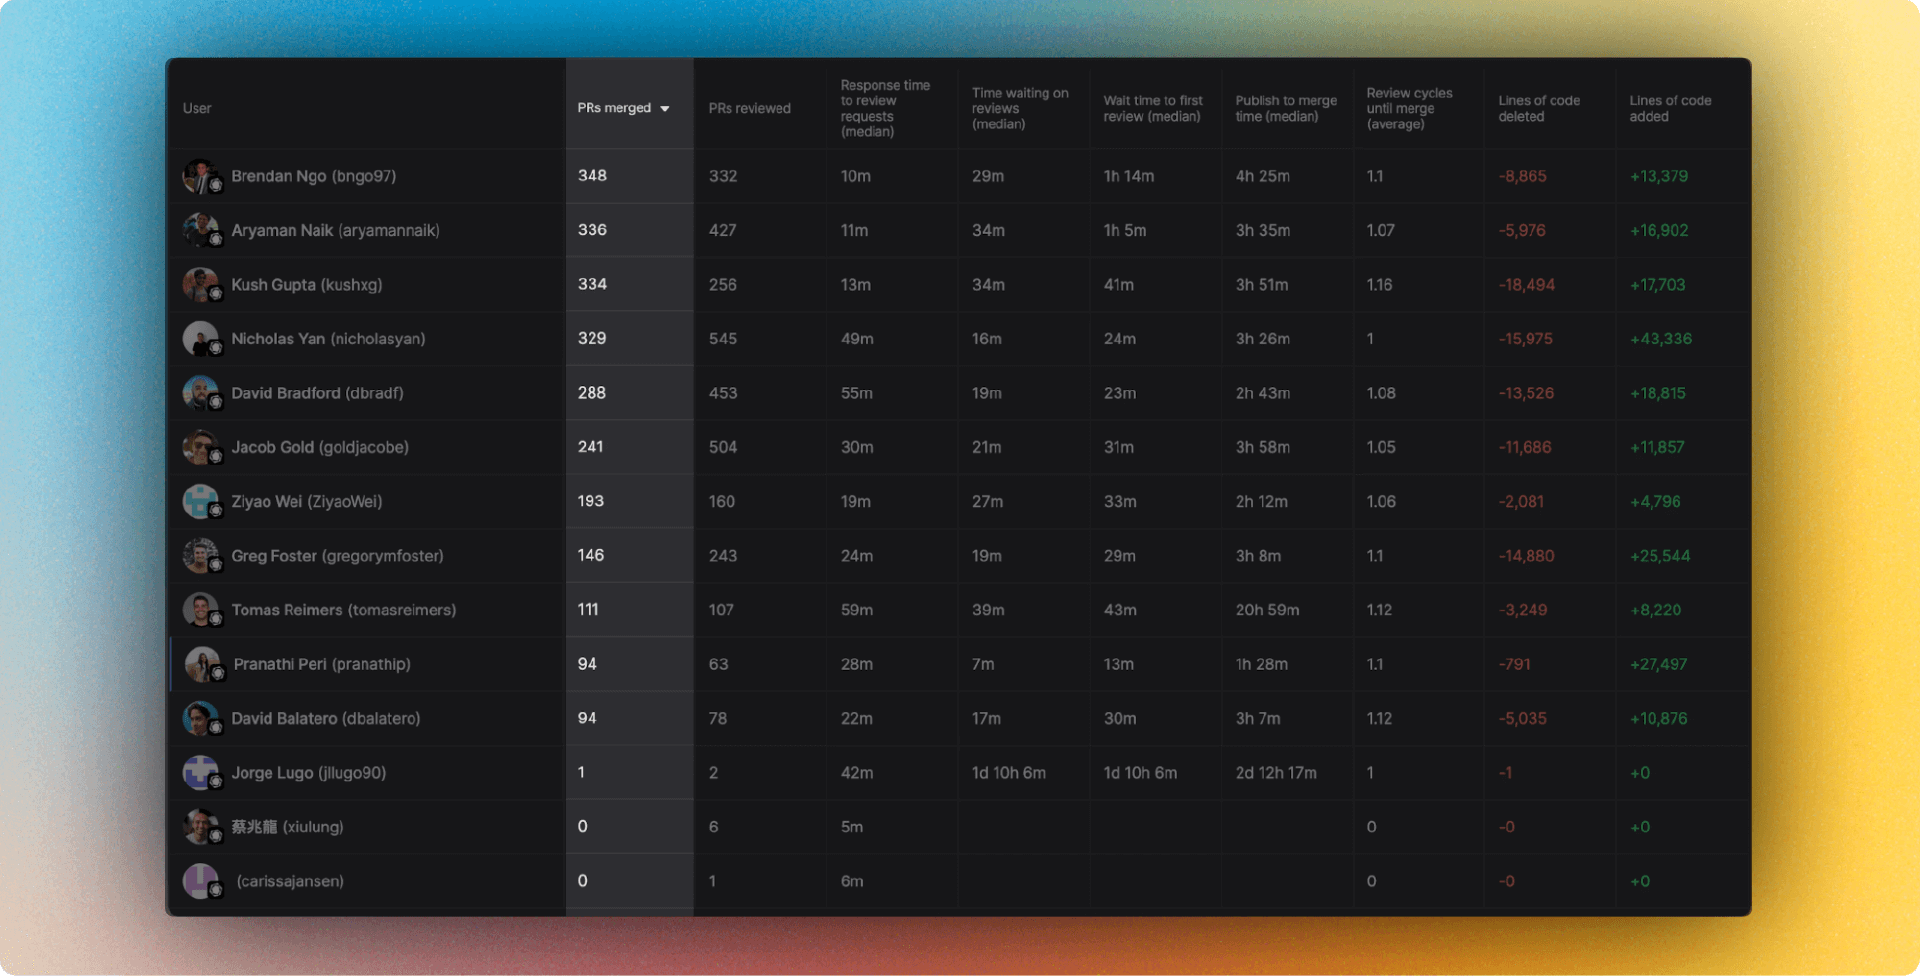
The first fundamental PR metric is the team's overall throughput tracked by pull requests merged per time period. Generally, managers want to analyze daily, weekly, or monthly rates depending on release cycles.
Looking at total PRs merged, especially when coordinated with shipping velocity, helps managers right-size workflow and also helps answer questions like:
Do developers have enough time built-in to learn, innovate, and maintain health?
Is the team keeping pace with internal roadmaps and external expectations?
With merge rates visualized, managers can instantly identify gaps from projections and investigate blockers like review bottlenecks. If throughput drops periodically, leaders can research seasonal factors like holidays and adjust planning accordingly. This clear throughput tracking provides a 30,000-foot view into team bandwidth.
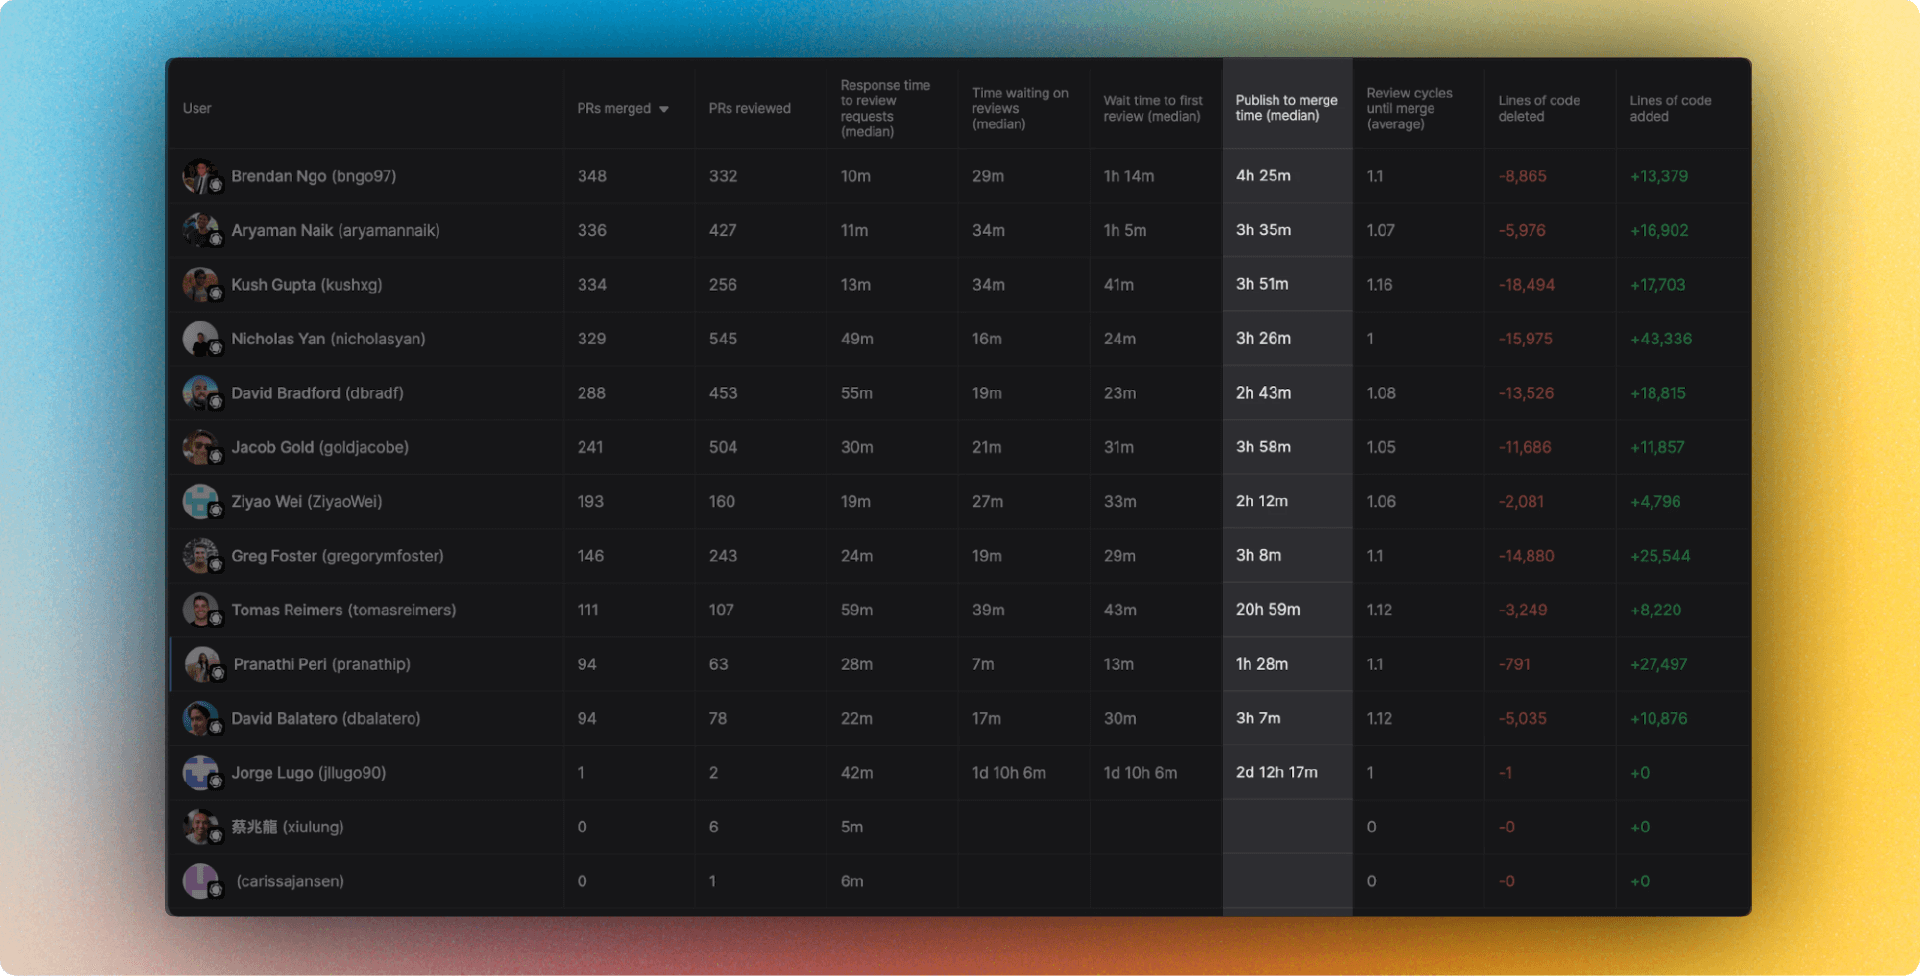
Review cycle times by project area
In addition to the overall volume of work, developers and managers need visibility into pull request cycle time—the duration from PR creation to merge. Faster cycle time shows that you are shipping code faster with minimal delays throughout the pipeline.
Cycle time often varies, however, across projects and lines of business.
For instance, front-end feature development may progress quicker than hardcore database refactoring. With the ability to filter PRs, setting reasonable expectations or identifying areas for targeted improvements can be possible.
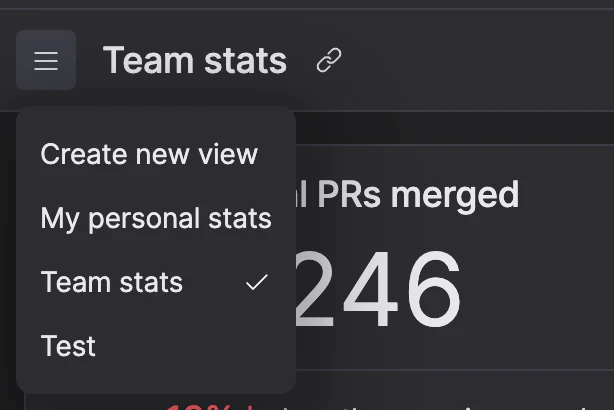
Graphite's Insights dashboards tackle this problem through customizable PR segmentation. Managers can instantly filter cycle times by:
Specific repositories
Authors
Assignees
And much more
Segmenting by project area provides realistic cycle time benchmarks tailored to the work. If UX pull requests show a much slower turnaround than API changes, for example, the dashboard makes this clear:
By drilling into categories of delays, the analysis prompts informed follow-up questions:
Does more complex code require further mentorship?
Are dependencies between systems delaying testing?
Is the team understaffed in key areas?
Without the Insights’ filters, such hypotheses would remain just guesses instead of data-driven explanations.
Work distribution across reviewers
Unexpected delays may arise—not because someone is unproductive—but because reviewers have too much work.
Ideally, PR reviews should be balanced evenly across qualified reviewers, and, if possible, based on their skill sets.
Here, too, Graphite’s Insights dashboards can help you see signals about review distribution. You can also automatically distribute work using Graphite automations.
Understanding when a team member is overloaded can help managers figure out better ways to distribute work and improve team morale.
Putting insights into action with Graphite for GitHub PR dashboards
We have only scratched the surface of available PR metrics within the Graphite Insights dashboards. You can dig deeper and customize the dashboards to fit your unique workflows. However—and more importantly—rather than just presenting metrics, Graphite’s Insights is aimed at helping you take action:
**Help developers do what they do best: **Instead of letting developers waste time on unnecessary PR management, the insights from Graphite can help you create workflows that free developers from the grunt work and help them focus on the code.
**Optimize review cycles: **Review delays can bottleneck your development team. As you understand better what is causing these delays—if it’s due to skill set mismatch or overloaded reviewers—you can take the time to optimize them for your team's benefit.
**Celebrate consistency: **Graphite shows you exactly who consistently meets deadlines and targets—so you can recognize reviewers and developers—and encourage them to continue.
Implement standards across teams: Insights may also reveal that the current team-wide standards have holes in them. For instance, with Graphite Insights, you may notice that many PRs are directly published instead of going through a draft PR stage first.
Ultimately, Insights helps engineering teams build perfectly customized GitHub PR dashboards that can help make data-driven decisions with ease. The dashboard provides the mirror necessary to judge successes, failures, and everything in between.
Frequently asked questions
How to create a dashboard in GitHub?
GitHub doesn't provide a built-in dashboard feature for pull requests. While you can view individual PRs and basic repository statistics, GitHub lacks the comprehensive analytics needed for team management. This is why tools like Graphite exist—to fill this gap by providing:
- Real-time PR tracking across multiple repositories
- Customizable analytics dashboards
- Team performance metrics
- Review cycle time analysis
- Workload distribution insights
To create an effective PR dashboard, you'll need to use a third-party tool that integrates with GitHub's API, such as Graphite's Insights feature.
How to create a WIP PR in GitHub?
A Work In Progress (WIP) PR in GitHub is created using draft pull requests:
- Create a new branch for your feature
- Make your initial commits to the branch
- Open a pull request and select "Create draft pull request" instead of "Create pull request"
- Add "[WIP]" or "Draft:" to your PR title to make it clear it's work in progress
- Mark as ready for review when you're done by clicking "Ready for review" in the PR
Draft PRs prevent accidental merging and signal to reviewers that the code isn't ready for review yet.
How to make a GitHub PR template?
GitHub PR templates help standardize pull request descriptions:
- Create a
.githubfolder in your repository root - Add a
pull_request_template.mdfile inside.github/ - Write your template with placeholders like:
## DescriptionBrief description of changes## Type of Change- [ ] Bug fix- [ ] New feature- [ ] Breaking change- [ ] Documentation update## Testing- [ ] Tests pass locally- [ ] Added new tests for new functionality## Checklist- [ ] Code follows style guidelines- [ ] Self-review completed- [ ] Documentation updated
- Commit and push the template file
- Templates will auto-populate when creating new PRs
How to create a PR on GitHub?
Creating a pull request on GitHub involves these steps:
- Fork or clone the repository you want to contribute to
- Create a new branch from main/master:
git checkout -b feature-branch-name - Make your changes and commit them:
git add .thengit commit -m "Your commit message" - Push the branch to GitHub:
git push origin feature-branch-name - Navigate to the repository on GitHub.com
- Click "Compare & pull request" or "New pull request"
- Select your branch as the source and main as the target
- Fill out the PR description (templates will auto-populate if configured)
- Add reviewers and assignees if needed
- Click "Create pull request" (or "Create draft pull request" for WIP)
For teams using Graphite, the process is streamlined with features like automatic PR creation, stacking, and bulk operations that work seamlessly with GitHub.
Sign up for a free Graphite account today and get started in less than five minutes when you use your GitHub account.