Code reviews are a common source of frustration.
For starters, no one likes to have their work critiqued. Feeling ownership and pride over the code you’ve shipped is natural. Having it subjected to someone else’s approval may not feel good.
The code review process itself can also create bottlenecks across the team.
Developers wait for reviews to complete, leaving their pull requests (PRs) in limbo. Important feature work halts as they await approval for those PRs.
This situation also creates problems for reviewers. As the queue of pull requests (PRs) awaiting review expands, reviewers might rush through their evaluations, compromising between speed and thoroughness.
This situation can inadvertently introduce lower-quality code—and bugs.
How do you speed up the PR workflow while maintaining high standards?
The answer to that question lies in data.
More specifically, PR metrics.
Measuring specific GitHub PR metrics lets you identify patterns and bottlenecks in your code review process. These insights let you improve code review turnaround times without sacrificing code quality.
Let’s dig into the essential metrics and what they tell you about your team’s process.
1. Total pull requests merged
The total number of pull requests merged over a certain period indicates how many code changes your team has successfully integrated into the codebase.
This is a North Star metric for development teams.
The specific numbers of PRs will depend on many factors, including the team size and the software's complexity and maturity.
You can use total PRs merged as a directional indicator of the health of your development workflow and as a flag if things are getting bogged down somewhere in the process.
Is the number of merged PRs staying steady or increasing? If so, it likely indicates your team is actively developing new features, fixing bugs, and refining the code. Additionally, an increase in merged PRs suggests your code review process facilitates smooth progress, enabling PRs to be consistently integrated into production.
Is the number of PRs decreasing? In this case, your team’s development process may be suffering from one or more of the following bottlenecks:
Undefined development processes: Poor communication among team members, inadequate resources, and unrealistic timelines can pressure developers. These factors can lead to rushed work or cutting corners to meet deadlines. In turn, that stress can lead to mistakes or oversights, necessitating additional time for correction and review, ultimately causing further release delays.
Poorly defined requirements and scope creep: It's common for initial project requirements to transform and expand, requiring significantly more engineering hours than originally planned. The lack of required information upfront and extending the scope of individual stories can cause PRs to grow longer without changes being merged.
Inefficient code review process: Large and complex pull requests can slow down human reviewers, leading to delays. They can also make it more difficult to thoroughly review code changes, which could lead to reverts and rework later.
Slow CI feedback loops: Extensive tests and long feedback cycles can slow development as engineers wait for final approvals.
The first two bottlenecks often stem from cultural and organizational challenges within your team or business.
The second two are likely driven by the PR and code review process.
How do you know which problem you’re facing?
Use the total number of pull requests being merged as a leading indicator of potential problems. If it dips, analyze the other pull request metrics to diagnose the problem better.
2. Review response time
Review response time tells you how long it takes for reviewers to respond to new PRs after being assigned a review.
Analyzing this metric can help you understand if code reviews are taking longer than expected or if reviews are getting stuck in the queue.
Measuring response time is crucial because these delays can rapidly accumulate, leading to significant hold ups due to time zone differences, unavailable personnel, vacations, or context switching.
Let’s say a manager is assigned a PR to review on Wednesday. To avoid context switching, the manager chooses to postpone the code review until Friday. However, the author may work from a different time zone, meaning they aren’t around to respond to the review suggestions until Monday of the following work week.
A task that should have been completed in a day has now taken nearly a week.
In the meantime, the engineer who submitted the review request has been blocked from progressing, and they’ve likely shifted their focus to something else. This disconnect can lead to further delays and issues.
Many companies have code review guidelines or internal review SLAs. For instance, Google says, “one business day is the maximum time it should take to respond to a code review request.” This standard ensures the author isn’t stuck waiting for a teammate’s code review.
If your team’s review response time is slower than you’d like or increasing, this likely indicates a problem such as:
Large PRs: Reviewers put off diving into a complex review task.
Lack of bandwidth: Reviewers don’t have time to respond quickly to code review requests.
Misaligned workflow: Code review handoffs happen at inopportune times due to time zone conflicts or other factors.
The issue here may simply be time. There are only so many hours in the day, and code review often takes a backseat to pressing projects and focused development. If that’s the case, the only solution might be adding capacity to the team.
Before you assume that bandwidth is the blocker, look at the timing of the handoffs and review requests. As the example above outlines, time zones can work against remote teams. If review requests come in at the start of the day in California, European engineers may not see them until the next day.
Look for opportunities to engineer code review cycles to take advantage of any time zone differences.
Usually, that means code reviews are submitted earlier in the day between team members in similar time zones and later between team members in significantly different time zones.
Finally, it’s important to analyze the amount and complexity of the code to be reviewed. One might assume that batching code reviews with larger PRs could help reduce context switching and expedite the process. To some extent, that’s true.
However, large PRs can slow down development.
Most code reviewers are wary of large PRs. Based on the sheer number of files and lines changed, they take longer to review, making it tedious work. Plus, they’re harder to revert when things go wrong.
In the interim, your engineers can’t work on anything that depends on that pending code review, leading to slower progress and setbacks.
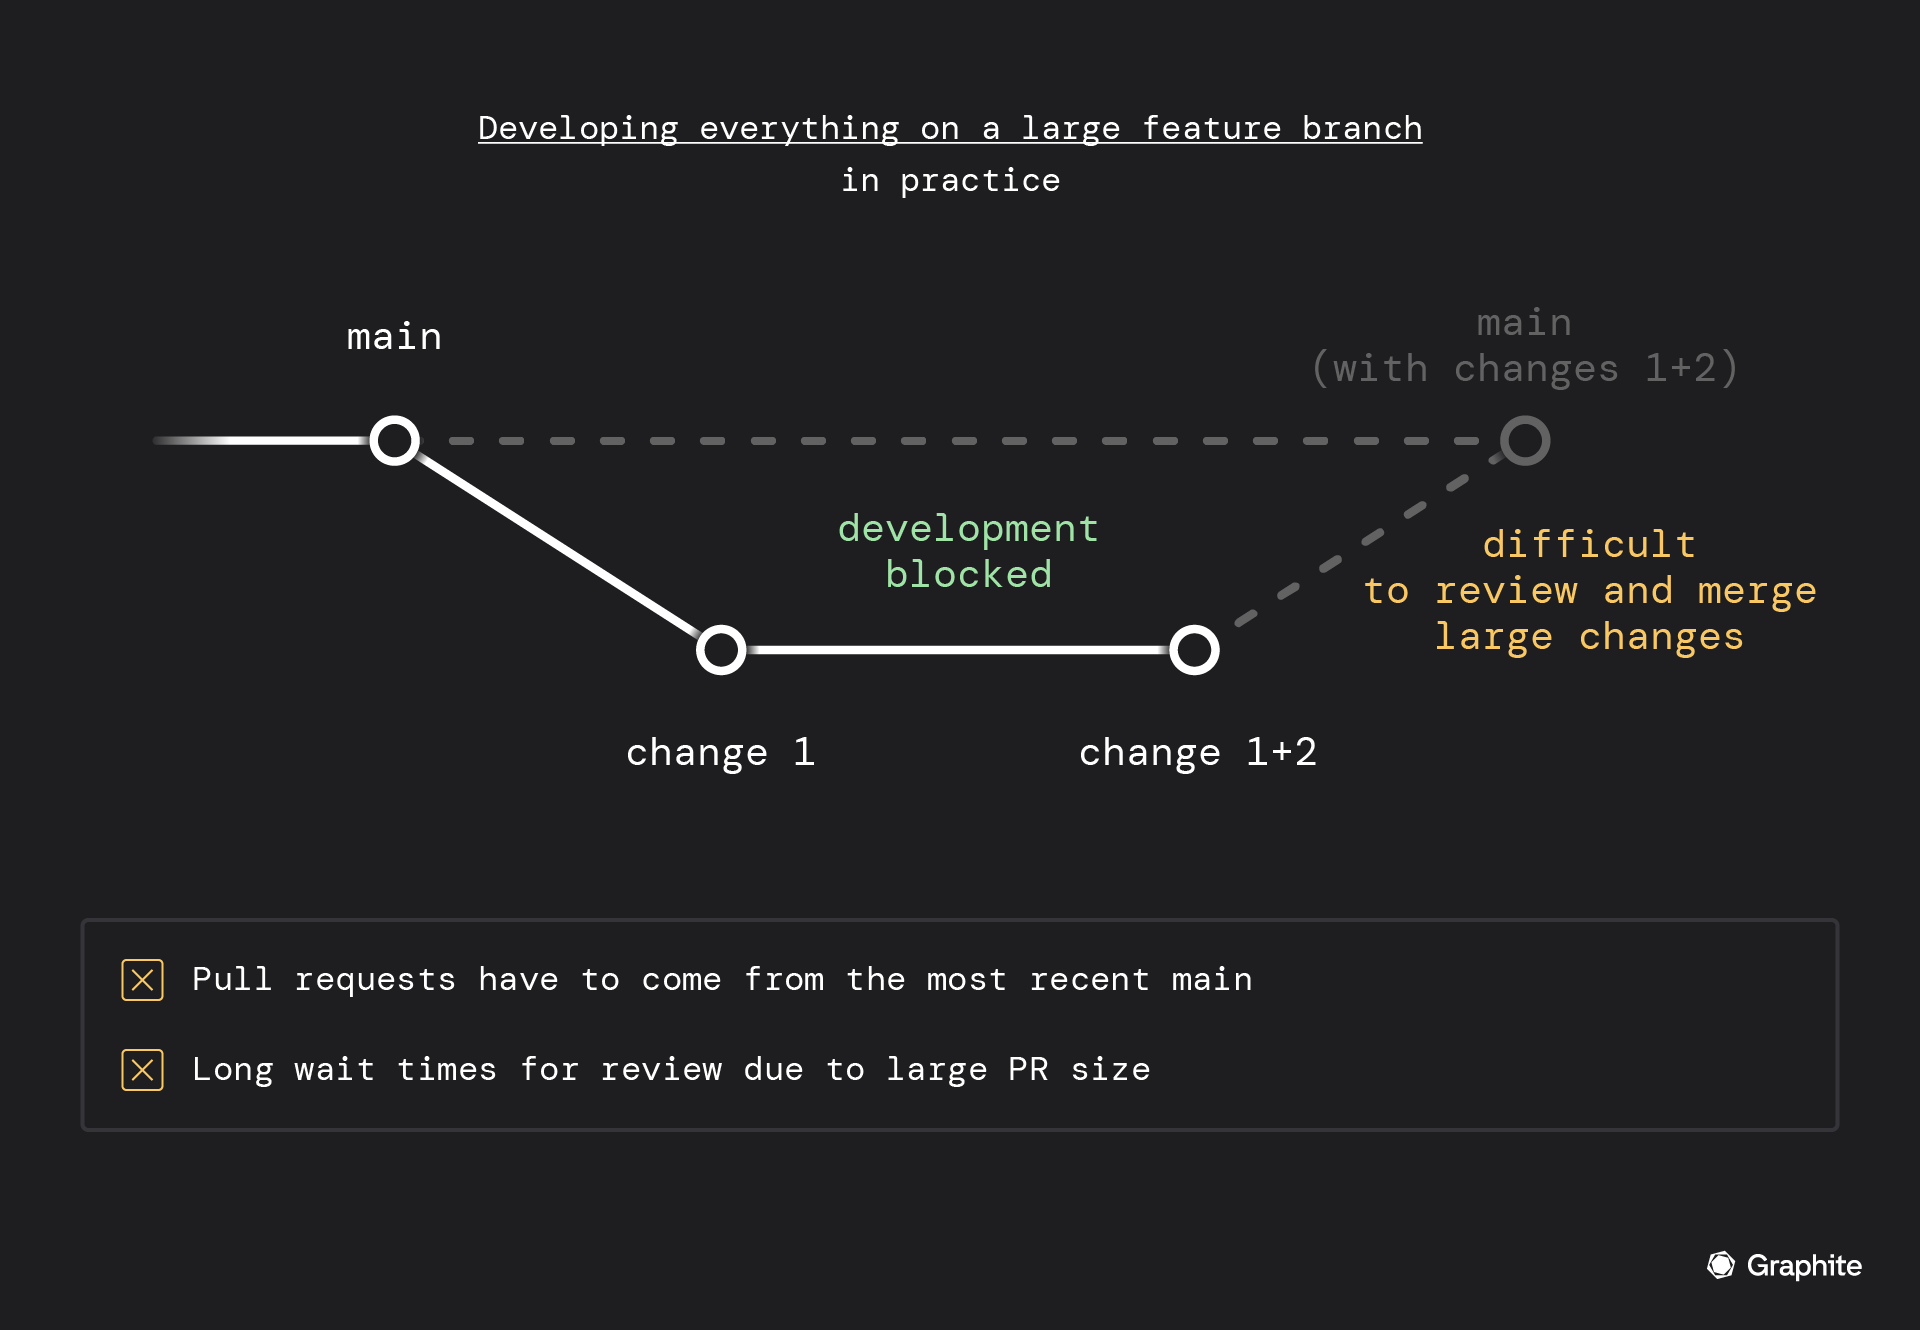
To get out of this rut, PRs should be small and modular; this is where stacking comes in.
Stacking PRs lets you create a series of PRs where each new one adds to the changes made in the previous. This approach allows you to keep submitting new PRs with additional changes while earlier ones undergo review.
After an earlier pull request is reviewed and merged, subsequent pull requests are updated to reflect the latest state of the code. This process ensures that your changes remain synchronized and can be integrated smoothly, maintaining momentum in the workflow even during the review process.
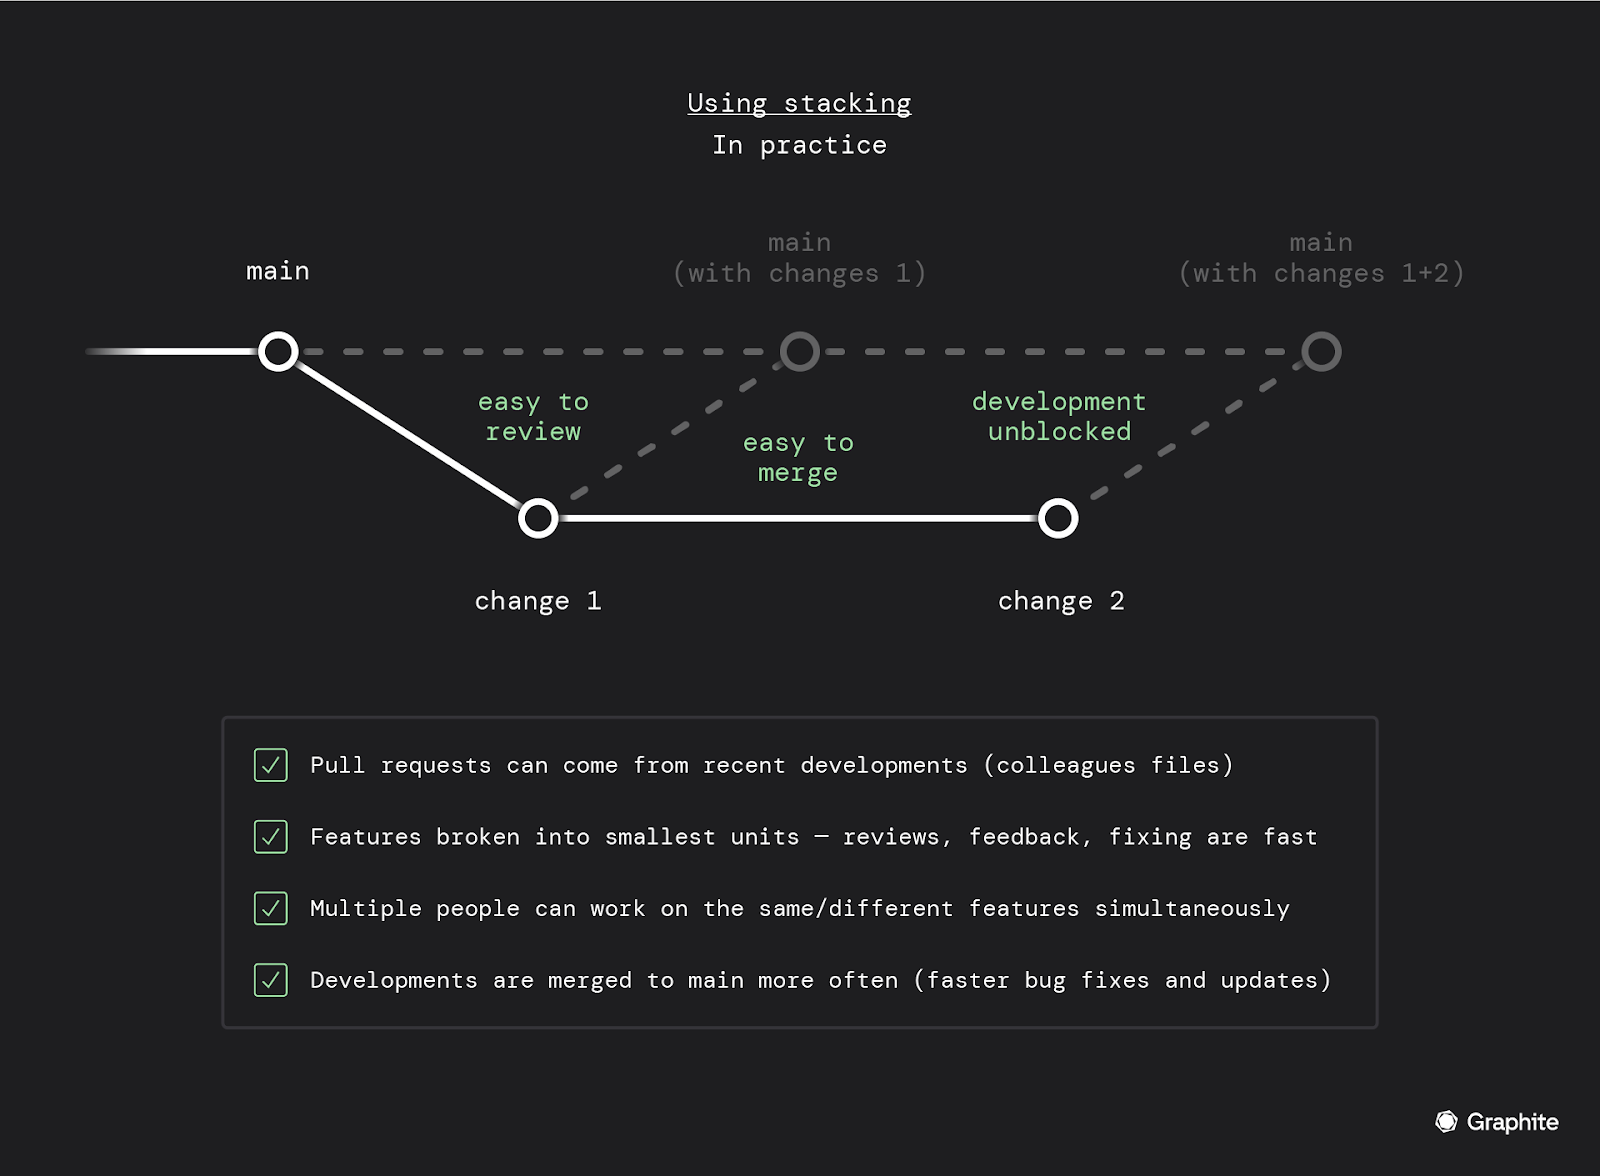
Stacking offers two key benefits that improve review response times and other GitHub PR metrics:
**Simplified reviews: **By encouraging smaller PRs, stacking makes reviews more manageable. This ease of review can lead to quicker feedback times and overall faster code review processes.
**Continuous progress: **With stacking, teams can enhance their overall speed and output, as subsequent PRs don't get held up awaiting reviews.
3. Wait time to first review
The** **wait time to the first review measures the median time from when a PR is created until the first review is submitted.
It’s valuable to analyze this separately from the overall review response time. Between the two metrics, you can parse whether the initial or subsequent reviews may slow down the process.
For example:
Wait time to first review is high, and review response time is low: This indicates that the first review takes longer than subsequent reviews.
Wait time to first review is low, and review response time is high: This indicates that subsequent reviews take longer than the initial review.
Wait time to first review is high, and review response time is high: This indicates that all reviews take approximately the same amount of time, and the review process itself takes longer than expected.
It’s possible to identify a few solutions based on our analysis.
If the initial review takes significantly longer, it could be caused by large PRs driving reviews to put off the review task.
If subsequent reviews are taking longer than the first review, it could be caused by poor communication or timing.
If all reviews are taking longer than expected, it could be caused by large PRs, slow code review processes, or time misalignment.
4. Review cycles until merge
Review cycles until merge tell you how many times a PR is exchanged between its author and a reviewer.
For example:
Zero review cycles: The author merges a PR without any review.
One review cycle: The author opens a PR, and the reviewer approves the merge.
Two review cycles: Author opens a PR, reviewer provides suggestions. Author resubmits PR for a second review. Reviewer approves and merges.
The review cycles metric is like a health score of your code review processes. It’s important to consider the implications of both a high number of review cycles and a low number.
A high number of review cycles may signal code quality issues, requiring PRs to undergo multiple rounds of review to address concerns or fix bugs.
Multiple review cycles can also stem from large, complex PRs requiring more review and iteration.
Conversely, fewer reviews can indicate issues with the review culture. For instance, developers could be bypassing reviews altogether, or reviewers could be glossing over the code before merging.
Paradoxically, fewer review cycles could also indicate that PRs are too large and complex.
After analyzing over seven million PRs, we noted that the average time to merge peaks when the PR has 1-2k lines of code.
This means it either takes multiple exchanges between the author and reviewer to get the code to be perfect, or the reviewers delay it due to the sheer size of the PR.
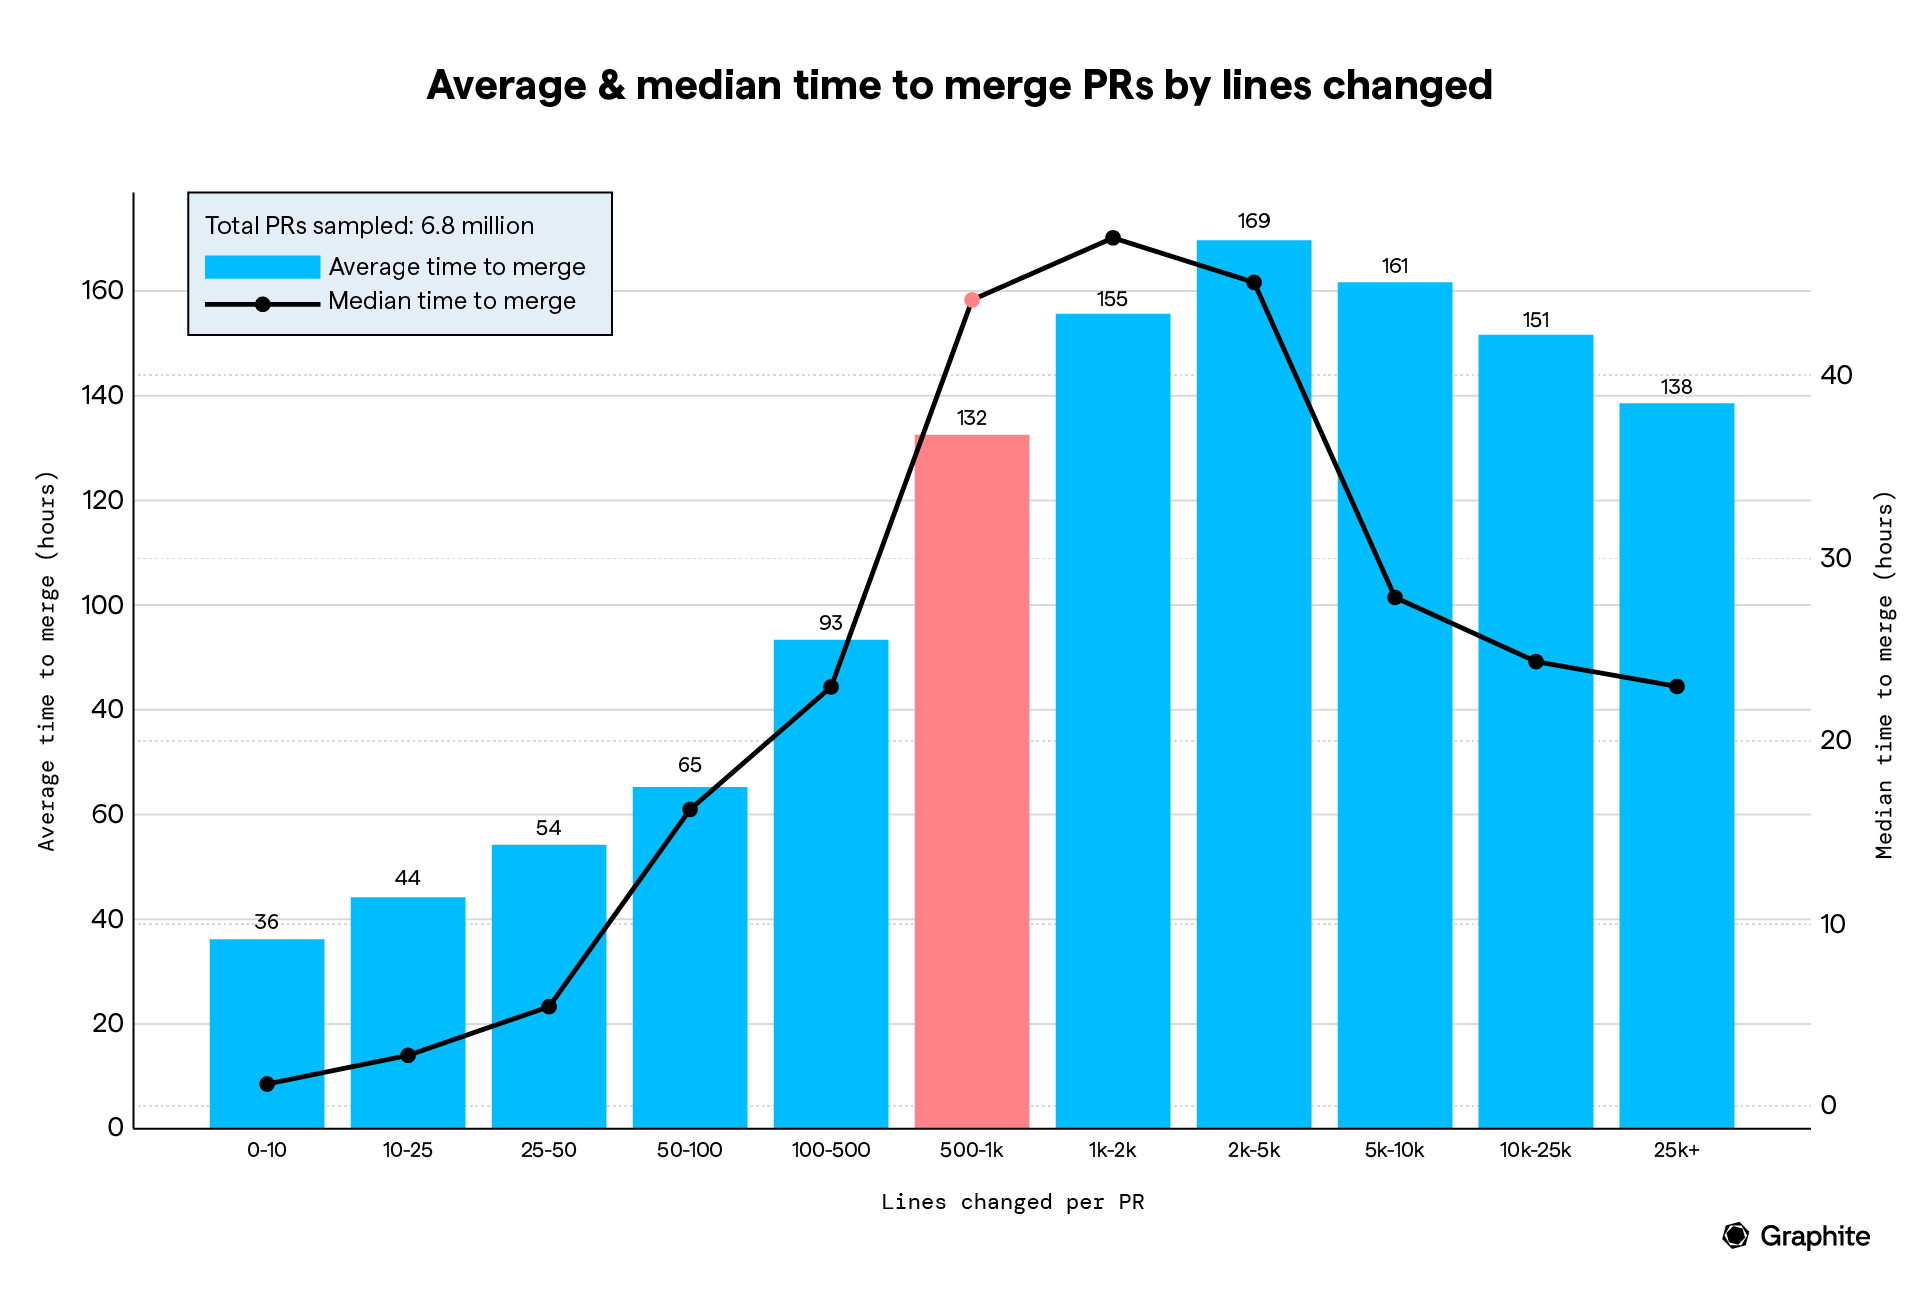
This finding confirms what we all know to be true. Large and complex PRs are often approved without careful examination rather than being thoroughly reviewed.
This kind of practice can lead to many downstream problems.
5. Pull requests merged per engineer
PRs merged per engineer tells you the average number of PRs merged by each team member.
Like the total number merged, this metric is most valuable as a directional indicator. The volume of PRs will vary greatly depending on the team and the software.
This metric can be used as a valuable temperature check. If an individual’s velocity has significantly increased or decreased, it’s worth exploring what caused the change. It could be a variance in workload or a shift in focus, or it could be a result of systemic challenges that introduced new blockers.
Beware: Using this metric as a KPI for individual developer performance can introduce destructive anti-patterns within your team. For instance, if developers are evaluated based on sheer velocity, they can be incentivized to game the metrics by simply shipping code more frequently or sacrificing quality for expediency.
On a similar note, it’s often not useful to compare the performance of multiple developers based on their individual velocity. Again, the scope and complexity of each individual’s workload can greatly vary the number of PRs being shipped.
However, providing feedback and guidance to team members can be helpful. Engineers who create small and modular PRs are more likely to have higher PRs merged. A high number of PRs merged per engineer also correlates with quicker code turnarounds.
In this situation, you can shorten the time to review code by looking at the metric that shows how many individual PRs each engineer merges. This approach can help pinpoint engineers who usually make large changes, leading to conversations about the benefits of dividing work into smaller, more manageable pull requests.
Effortlessly measure essential GitHub PR metrics with Graphite
GitHub, the largest source-code management platform, recently released the Issue Metrics GitHub Action. The tool helps you measure basic metrics like:
Time to first response (duration from PR creation to initial comment or review).
Time to close (period from PR creation to its closure).
However, for more details from the GitHub PR analytics report, you’ll need to configure the search query and manage labels manually.
If you don’t want to put extra effort into configuring queries or managing labels, consider using Graphite Insights. Its customizable dashboard allows you to create, save, update, and share custom views for various stats and metrics across your entire team.
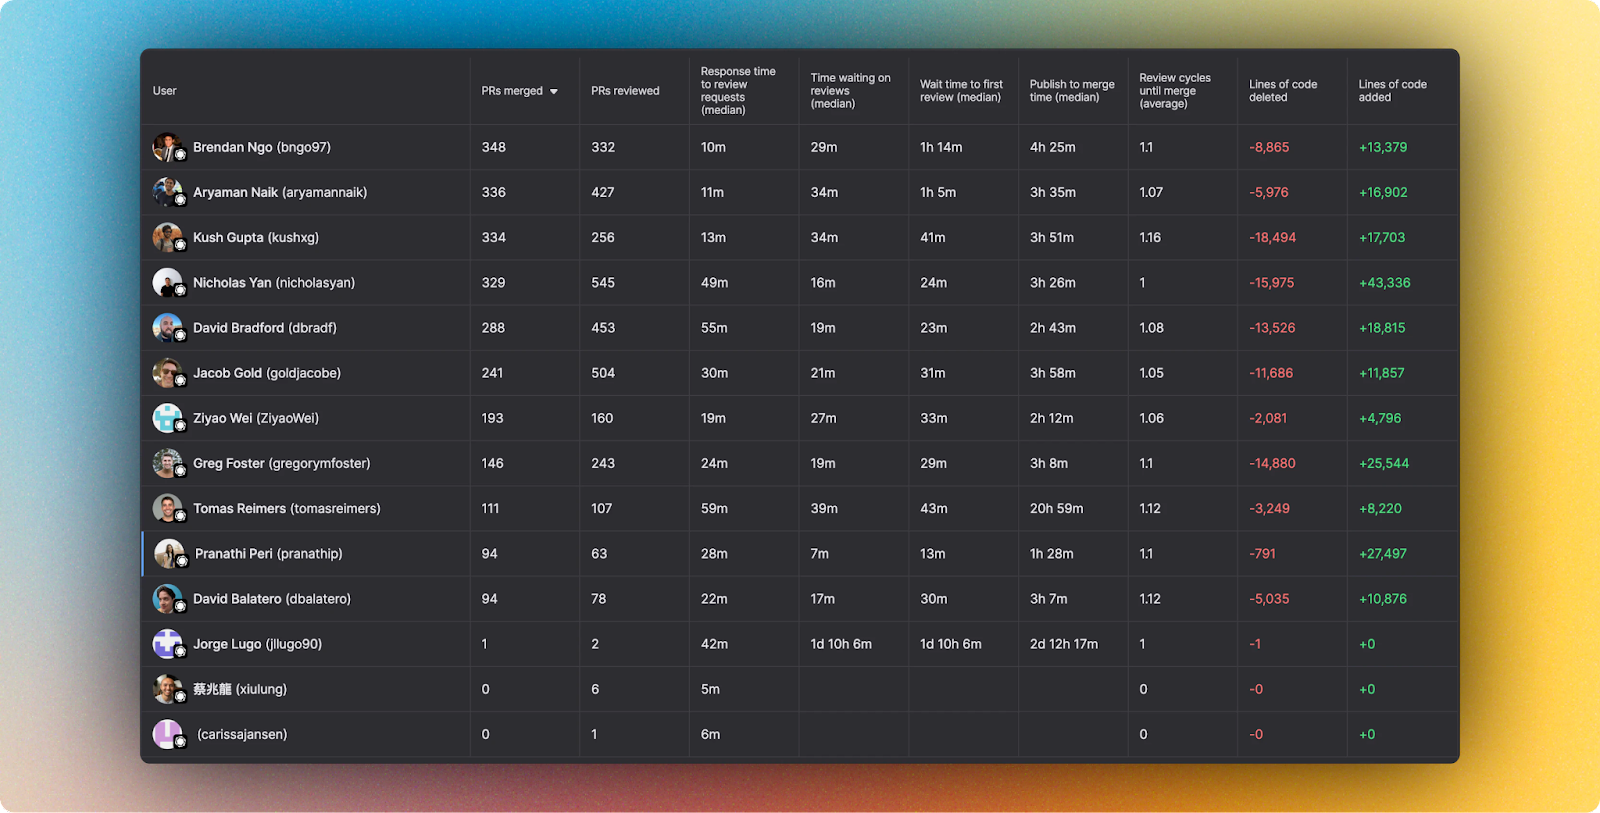
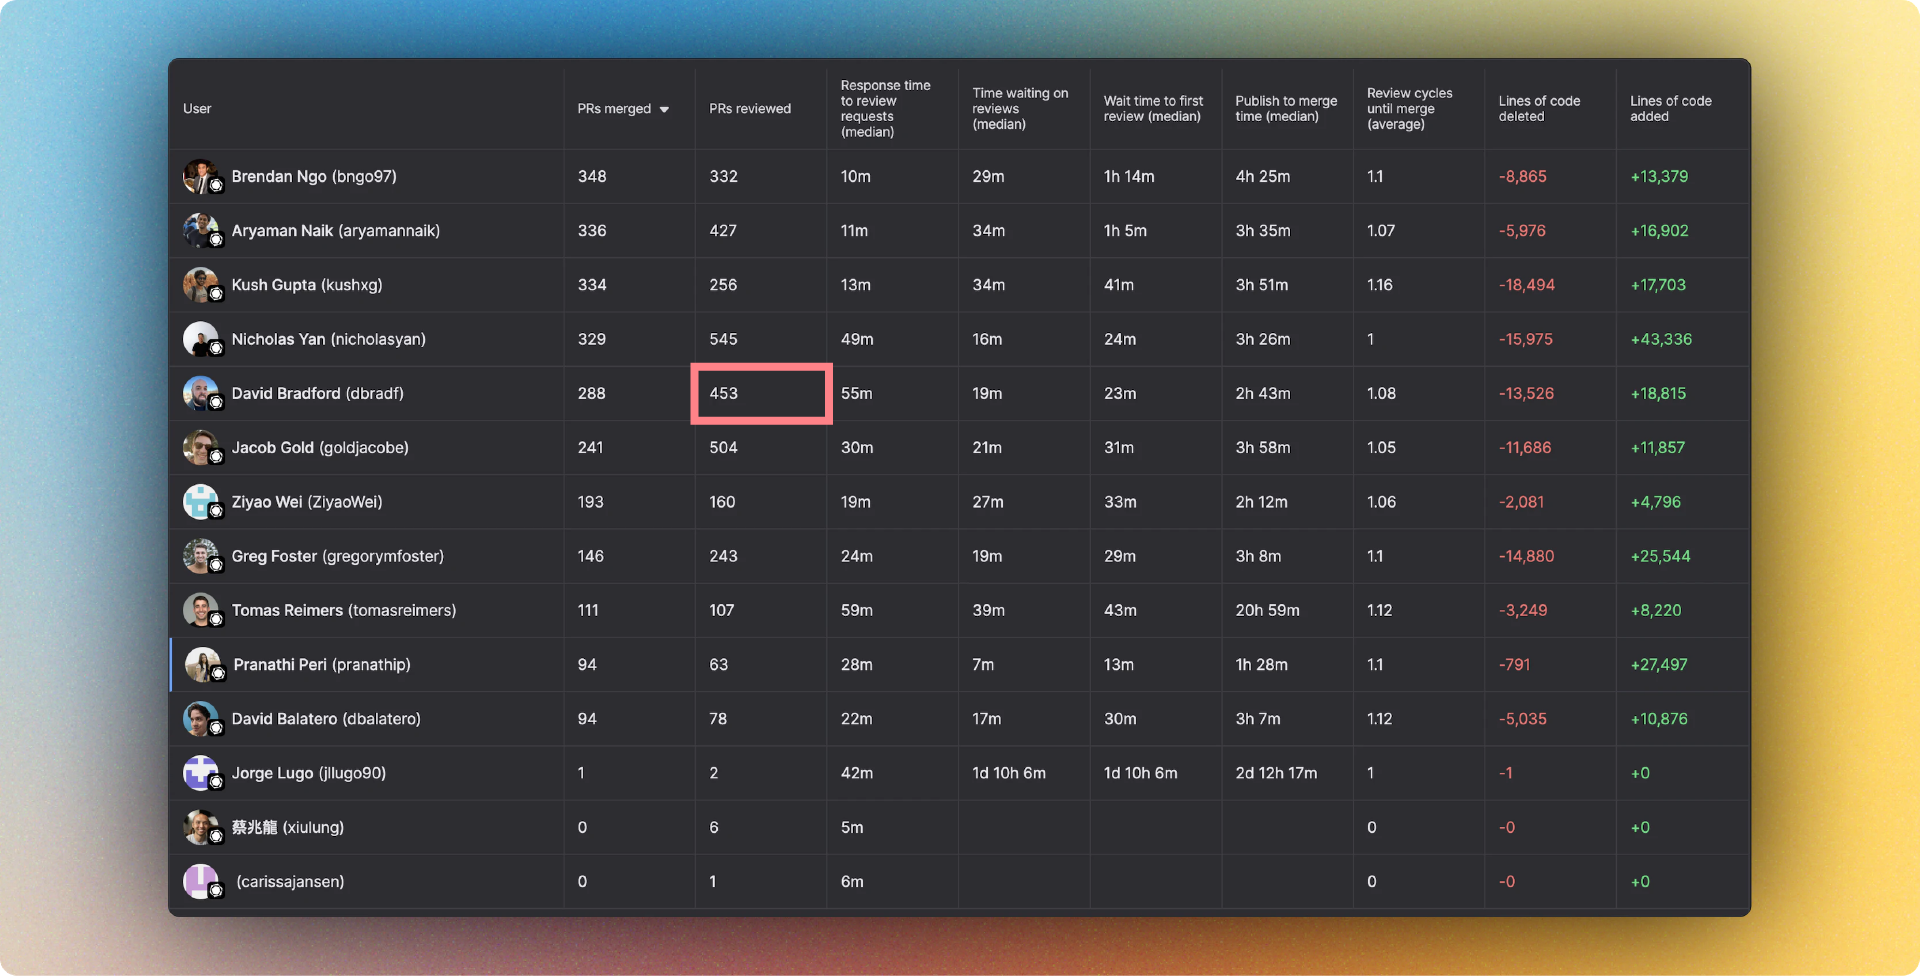
By default, Graphite Insights shows the following metrics for each user:
Total PRs merged
Average number of PRs merged per person
Average number of PRs reviewed per person
Median publish to merge time
Median review response time
Median wait time to first review
The average number of review cycles until merge
Number of PRs reviewed per person over a time period (as a line graph)
Number of PRs reviewed by Graphite users vs. non-Graphite users over a time period (as a line graph)
Number of PRs merged per person over a time period (as a line graph)
With this perspective, for example—without writing a single query, you can easily find out that David Bradford has reviewed 453 PRs this cycle.
With Graphite Insights, you can get instant data on the health of your team’s workflows and routines. This information will help you find ways to improve processes and the developer experience.