Measuring developer productivity is important for understanding team performance, identifying bottlenecks, and improving workflow efficiency in software development. In addition to covering traditional metrics such as those measured by the DORA and SPACE frameworks, this guide also details other important metrics such as total pull requests (PRs) merged, PRs merged per engineer, and others, explaining how each contributes to a holistic view of productivity.
What are DORA metrics?
DORA metrics, which stand for DevOps Research and Assessment, were introduced by Dr. Nicole Forsgren, Jez Humble, and Gene Kim through the annual State of DevOps reports that began in 2014. These metrics are indicators of an organization's DevOps health and performance. The four key DORA metrics are:
- Deployment frequency: This metric measures how often an organization successfully releases to production. Frequent deployments are typically a sign of a high-performing team that can quickly deliver improvements and features to users.
- Lead time for changes: This measures amount of time it takes a commit to get into production. Shorter lead times can indicate streamlined, efficient development and deployment processes.
- Change failure rate: This metric measures percentage of deployments that cause a failure in production. Lower change failure rates suggest robustness in testing and deployment practices.
- Time to restore service: This describes the time it takes to recover from a failure in production. A shorter recovery time points to a resilient infrastructure and effective incident management practices.
These metrics provide insights into the effectiveness of software development practices, emphasizing the speed and stability of software delivery.
What are SPACE metrics?
SPACE metrics, introduced by a group of researchers including Margaret-Anne Storey, Thomas Zimmermann, Christian Bird, and others in a 2020 publication, aim to provide a more holistic view of developer productivity. SPACE is an acronym for:
- Satisfaction and well-being: Assessing the contentment and mental health of developers.
- Performance: Usually based on outcomes like code quality or completion of tasks.
- Activity: Keeping track of metrics like code churn and the number of code reviews.
- Communication and collaboration: Evaluating how effectively team members interact and work together.
- Efficiency and flow: Measuring the ease with which developers can complete tasks without interruptions.
Unlike DORA metrics, which focus more on delivery and operational aspects, SPACE metrics encompass a broader spectrum of developer experience and productivity, emphasizing individual and team health and sustainability.
History and evolution of these metrics
The development of these metrics was driven by the need to address the lack of clear, actionable metrics in software development. Before DORA and SPACE, productivity was often measured by outputs like lines of code, which do not accurately reflect the effectiveness or quality of software development practices.
DORA metrics evolved from research aimed at understanding high-performing IT teams and their practices, while SPACE metrics were developed to address the multifaceted nature of productivity, which includes developer satisfaction and team dynamics.
Other important metrics to measure developer productivity
Total PRs merged
Total PRs merged refers to the aggregate number of pull requests that have been successfully merged into the main branch over a specific period. This metric provides a high-level view of the team’s output and helps in tracking productivity trends.
PRs merged per engineer
PRs merged per engineer measures the median number of pull requests each developer successfully merges. This metric highlights individual contributions and can help in understanding how balanced the workload is across the team.
PRs reviewed per engineer
PRs reviewed per engineer counts the number of pull requests each team member has reviewed. This metric is vital for assessing the collaborative aspects of the team, ensuring everyone participates in the code review process.
Wait time to first review
Wait time to first review measures the median time it takes for a pull request to receive its first review after submission. Shorter response times can indicate a more responsive and engaged team, which often leads to faster development cycles.
Lines changed per PR
Lines changed per PR reflects the median number of lines of code added, deleted, or modified in each pull request. Smaller PRs are reviewed more quickly, more thoroughly, and are less likely to introduce bugs. Aim to keep PRs around 50 lines long.
Publish to merge time
Publish to merge time tracks the duration from when a pull request is opened to when it is merged. This metric is helps in understanding the overall efficiency of the development workflow, indicating how quickly code moves from development to production.
Review cycles until merge
Review cycles until merge counts the number of iterations a pull request goes through before it is finally merged. Cutting down on review cycles saves time for both the reviewer and author. Initial feedback should be comprehensive and addressed immediately without the need for further iteration.
Tools and strategies for tracking these metrics
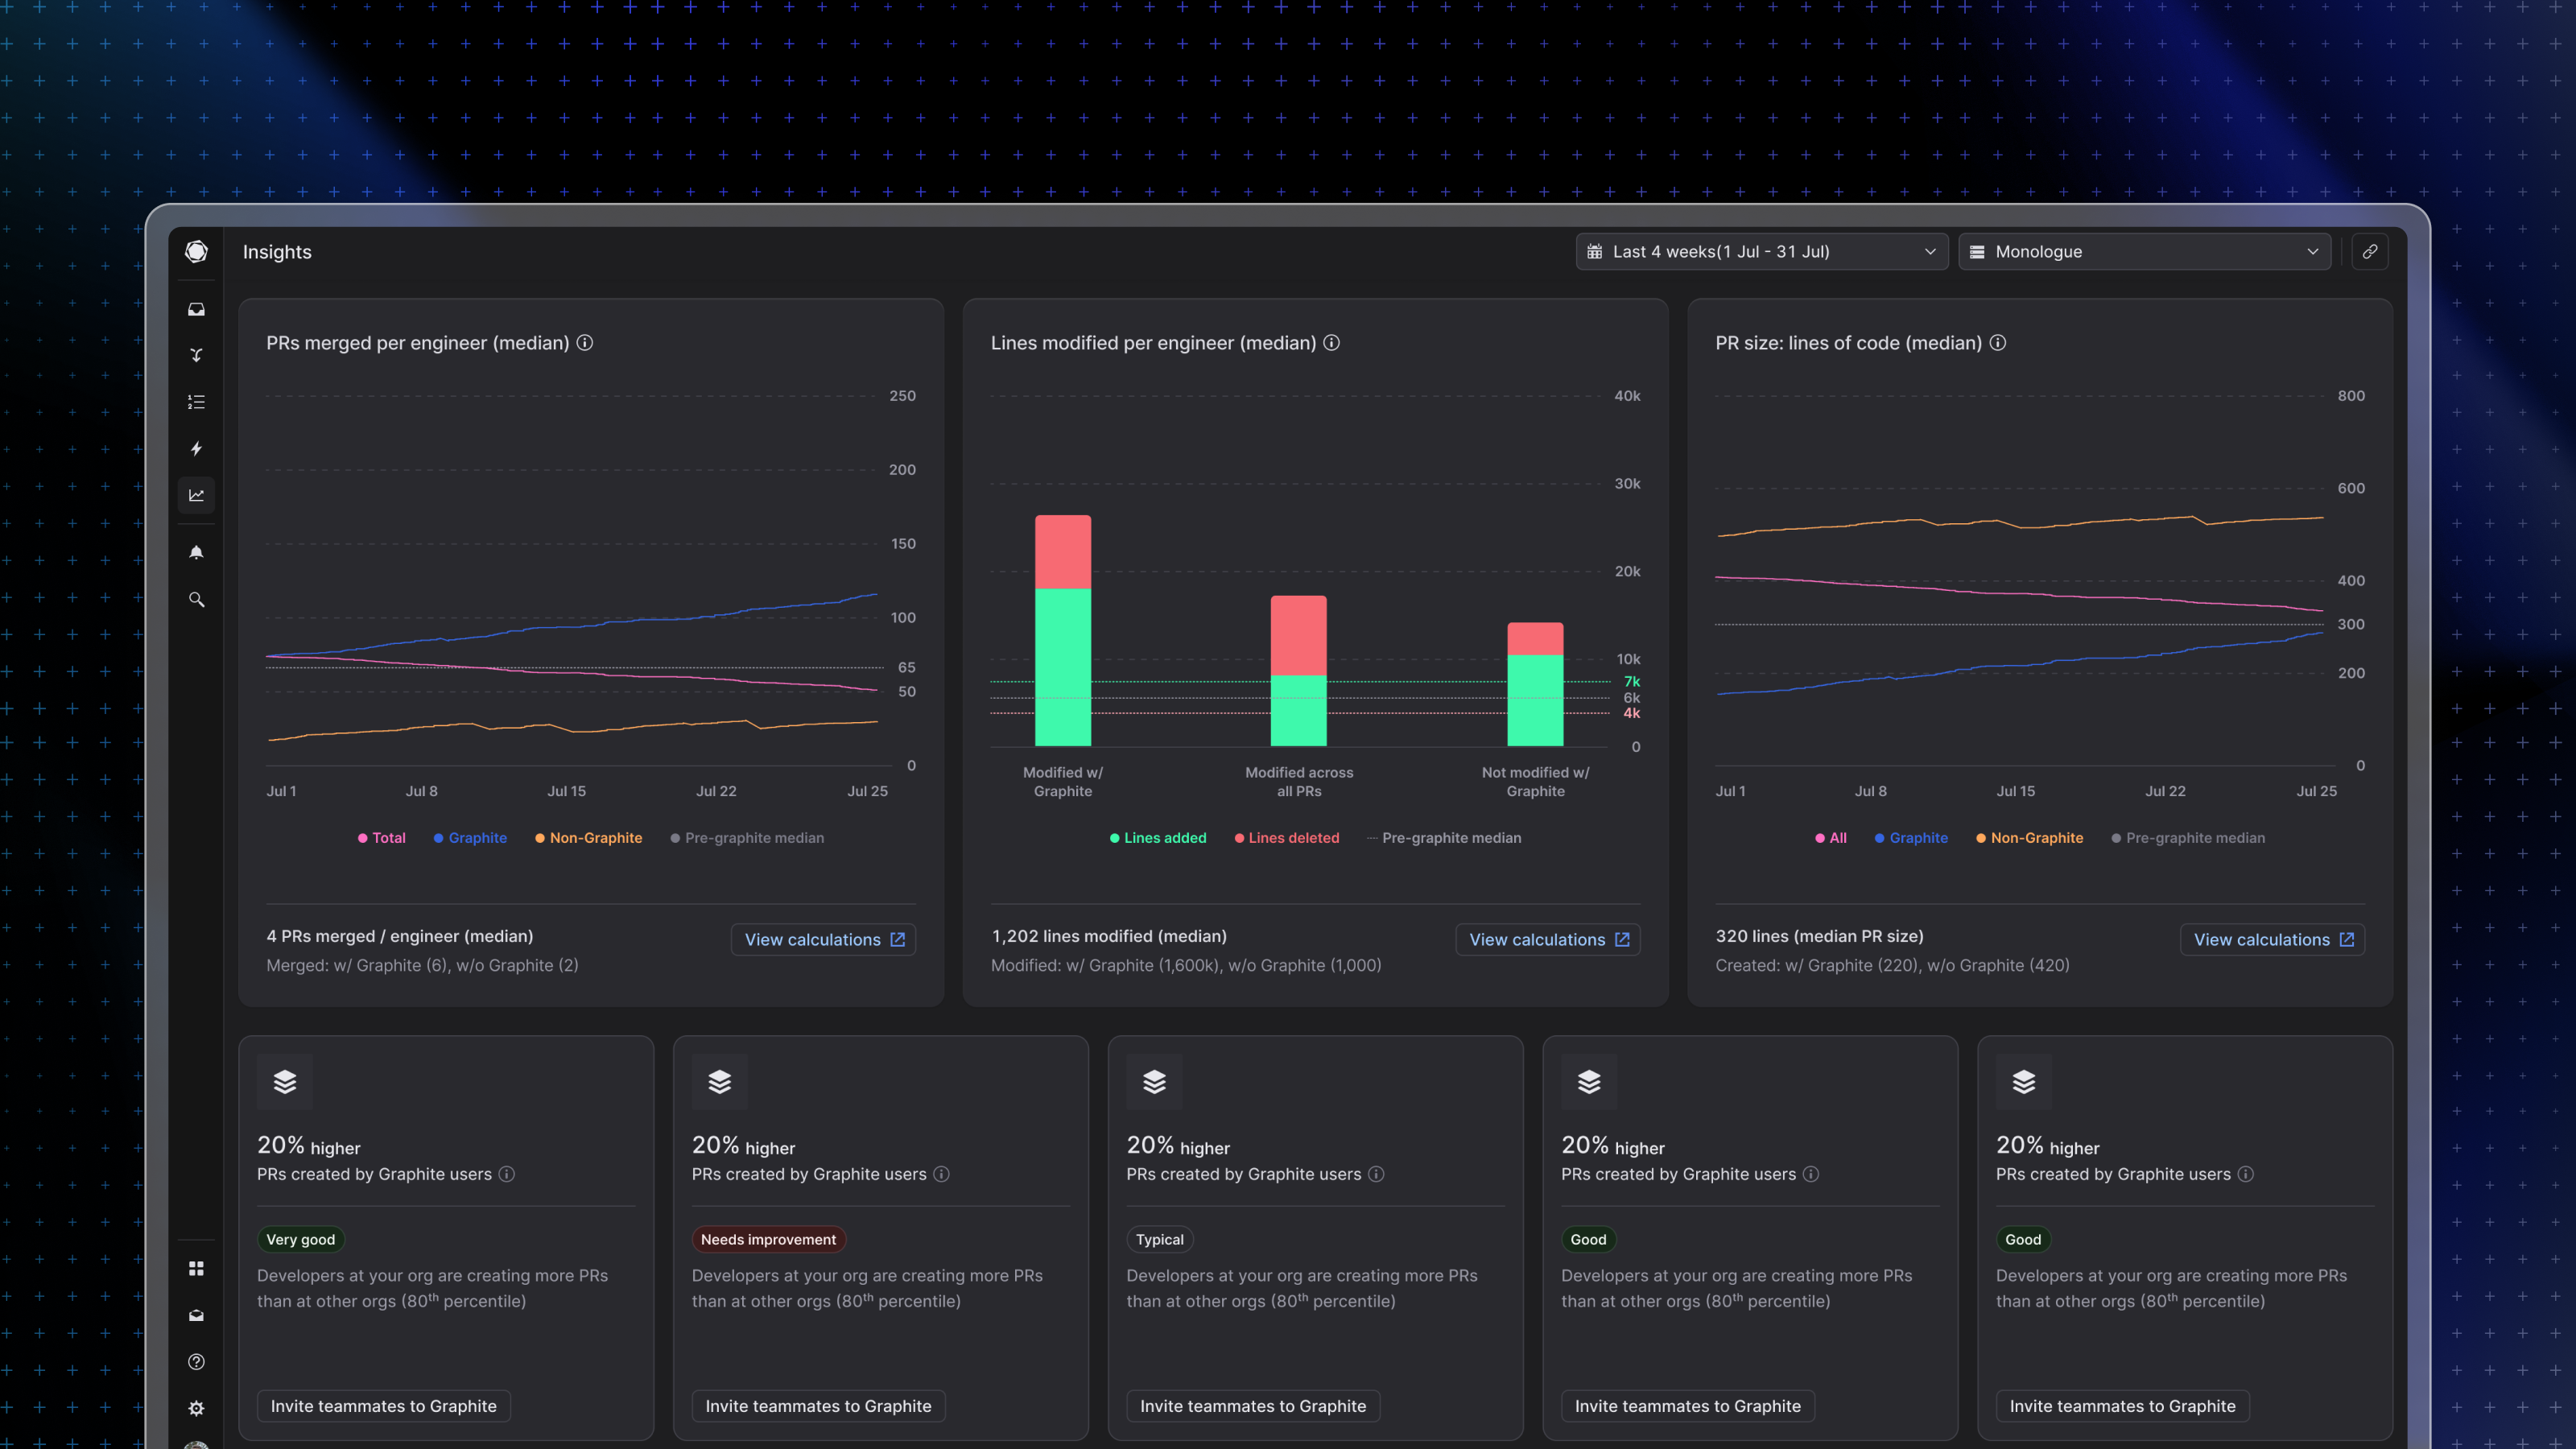
To effectively track these metrics, teams can use tools like Graphite. Graphite provides dashboards and analytics to help visualize productivity trends and pinpoint areas for improvement. Custom scripts and APIs can also be used to extract and analyze data tailored to specific needs.
Best practices for interpreting productivity metrics
- Contextualize data: Understand the scope and context of the data. High numbers of PRs might not always signify productivity if they are minor or trivial changes.
- Use multiple metrics: No single metric can provide a complete picture. Combining different metrics can lead to a more accurate assessment of productivity.
- Consider quality: Balance productivity metrics with quality indicators like bug rates, customer satisfaction, and software performance to ensure that increased output does not compromise quality.
- Regular feedback: Use these metrics for regular feedback sessions with teams to discuss improvements and acknowledge accomplishments, fostering a culture of continuous improvement. Avoid using these metrics to assign singular blame or evaluate individual engineer's productivity.
By effectively measuring developer productivity using the discussed metrics, teams can gain insights into their workflow, individual and collective performance, and identify areas needing enhancement. This approach not only optimizes productivity but also contributes to a more engaged and balanced team environment.